Mortality and healthcare costs in Medicare beneficiaries with AL amyloidosis
Abstract
Aims: Examine mortality and healthcare costs in Medicare beneficiaries with newly diagnosed immunoglobulin light chain (AL) amyloidosis. Patients & methods: Cases were identified in 2012–2015 Medicare 5% data with ≥1 inpatient/≥2 outpatient claims consistent with AL amyloidosis and ≥1 AL-specific treatment. Cases were matched 3:1 with disease-free controls. Descriptive statistics were reported. Results: A total of 249 (33.3%) cases were matched to 747 (66.7%) controls. A total of 19.7% of cases died within 1 year of follow-up versus 5.5% of controls; 30.6 versus 11.8% died within 2 years (p < 0.001). Mean (SD) costs in 1-year of follow-up were significantly higher among cases versus controls ($71,040 [65,766] vs $13,722 [27,493]; p < 0.001). Conclusion: Mortality was nearly four-times higher, and costs nearly five-times higher in beneficiaries with AL amyloidosis versus controls.
Amyloidoses refer to a group of rare protein folding disorders characterized by extracellular tissue deposition of misfolded and aggregated autologous proteins as β-pleated sheet fibrils [1]. Immunoglobulin light chain (AL) amyloidosis accounts for approximately 70% of all systemic amyloidoses and is therefore the most common form of these diseases [2]. The monoclonal light chains can irreversibly damage all organs, except the central nervous system, when they are deposited in the form of amyloid fibrils in tissues [3]. Current estimates suggest that at least 12,000 adults are affected by AL amyloidosis in the US, and this number may rise as an increasing prevalence rate was observed in our previous study with claims data [4]. In addition, the disease predominantly affects older adults, many of which are Medicare beneficiaries. Therefore, with rapid population aging coupled with increasing prevalence of AL amyloidosis, the number of Medicare beneficiaries with the disease will likely rise in the future [4,5].
Patients with AL amyloidosis have a poor prognosis with an estimated median survival ranging from 6 months to 3 years depending on the patient population, data used and progression of the disease [6–9]. However, survival following AL amyloidosis diagnosis has not been examined using real-world, nationally representative data in the USA. In our previous study with claims data, approximately 40% of patients had Medicare, and we were unable to examine mortality because these data were unavailable. In comparison, the current study examines both survival and costs in Medicare patients.
In a search of PubMed, we found no studies that examined the economic burden of AL amyloidosis using nationally representative, real-world data. However, in a previous study, we estimated the cost of AL amyloidosis patients was $122,180 in the year following diagnosis [10].
As the disease mainly affects individuals with advanced age, [11] most US patients with the condition are Medicare beneficiaries. In the current study, we sought to examine time to death, death rates and healthcare costs in the 1 year following diagnosis among Medicare beneficiaries with newly diagnosed AL amyloidosis. Specifically, we compared these outcomes between patients with AL amyloidosis (cases) and population-based, AL amyloidosis disease-free controls to provide greater context for the burden of illness that patients with AL amyloidosis face.
Patients & methods
Data sources
We used 2011–2016 data from the 5% Medicare Limited Data Set (LDS) for this retrospective, matched case–control study. The LDS contains a 5% random sample of Medicare beneficiaries, which is representative of the overall population covered by Medicare, the largest insurer of people aged 65 years and older in the USA. Data included information about year of birth, sex, race or ethnic origin, date of death (if deceased), reasons for Medicare entitlement and Medicare Advantage Plan (health maintenance organization) enrollment.
Medicare Part A and Part B files contain Medicare reimbursed claims from the following settings for fee-for-service enrollees: inpatient, outpatient, emergency room, physician office, skilled nursing facility, hospice, home health agency and durable medical equipment. Specifically, we used both beneficiary-level and claim-level data from the following individual files: Master Beneficiary Summary File, Inpatient File, Home Health Agency File, Outpatient File, Carrier (Physician/Supplier Part B Claims) File, Durable Medical Equipment File, Hospice File, Skilled Nursing Facility File.
We linked beneficiary information across Medicare files using encrypted identification numbers that are included on all patient- and claim-level files.
The Medicare claims data were created in accordance with the principles of the Health Insurance Portability and Accountability Act (HIPAA). The analysis of the LDS is exempt from a Privacy Board review.
Study population
The study population was comprised of the following two cohorts of Medicare beneficiaries: newly diagnosed AL amyloidosis beneficiaries, and matched, disease-free beneficiaries.
Cases: beneficiaries with incident AL amyloidosis
As there is no diagnosis code specific to AL amyloidosis, the following algorithm was used to identify Medicare beneficiaries with AL amyloidosis during the study identification (ID) period (01/01/2012 to 12/31/2015). Beneficiaries with AL amyloidosis were identified if they had at least one inpatient claim or two outpatient claims consistent with AL amyloidosis [International Classification of Diseases, 9th Revision, Clinical Modification (ICD-9-CM) codes: 277.30 (amyloidosis, unspecified) or 277.39 (other amyloidosis); International Classification of Diseases, 10th Revision, Clinical Modification (ICD-10-CM) codes: E85.4x (organ-limited amyloidosis), E85.8x (other amyloidosis), or E85.9x (amyloidosis, unspecified)] in any position on claims in the inpatient, outpatient or carrier files between 01/01/2011 and 12/31/2016 with the first observed diagnosis date (index date) occurred during the ID period, and received an intravenous treatment recommended in expert guidelines [12–16] for AL amyloidosis (bendamustine, bortezomib, carfilzomib, cyclophosphamide, dexamethasone, prednisone, lenalidomide, melphalan, pomalidomide, thalidomide or hematopoietic stem cell transplant) within 90 days prior to or any time on or after the index date in the study period. As Medicare Part D data are not available in the study database, treatments were limited to hematopoietic stem cell transplant, injectable drugs and oral prescription drugs covered under Medicare Part A and Part B. The first observed AL amyloidosis diagnosis date was the index date. To ensure that all beneficiaries were newly diagnosed AL amyloidosis patients, they were excluded if they had any diagnosis of AL amyloidosis during the 1 year prior to the index date (baseline period).
The above beneficiaries were required to be age ≥66 years on the index date to ensure ≥1 year of pre-index eligibility; have continuous enrollment in fee-for-service Medicare and be eligible for Medicare Parts A and B for 1 year prior to the index date; and be enrolled in fee-for-service Medicare for at least 1 year after the index date, with the exception of beneficiaries who died during the year. All beneficiaries were followed until the end of enrollment, death or study end, whichever occurred first.
Population-based, disease-free controls: beneficiaries without AL amyloidosis
Among patients who never had a single claim consistent with AL amyloidosis in the study period, controls were matched with cases in a 3:1 ratio based on age, gender, race and geographic location. Controls were assigned to have the same index date as the corresponding case. The same insurance type and continuous enrollment inclusion criteria were applied to the controls as the cases (see Figure 1 for the study timeline). A similar matching approach has been used in a previous study [17].
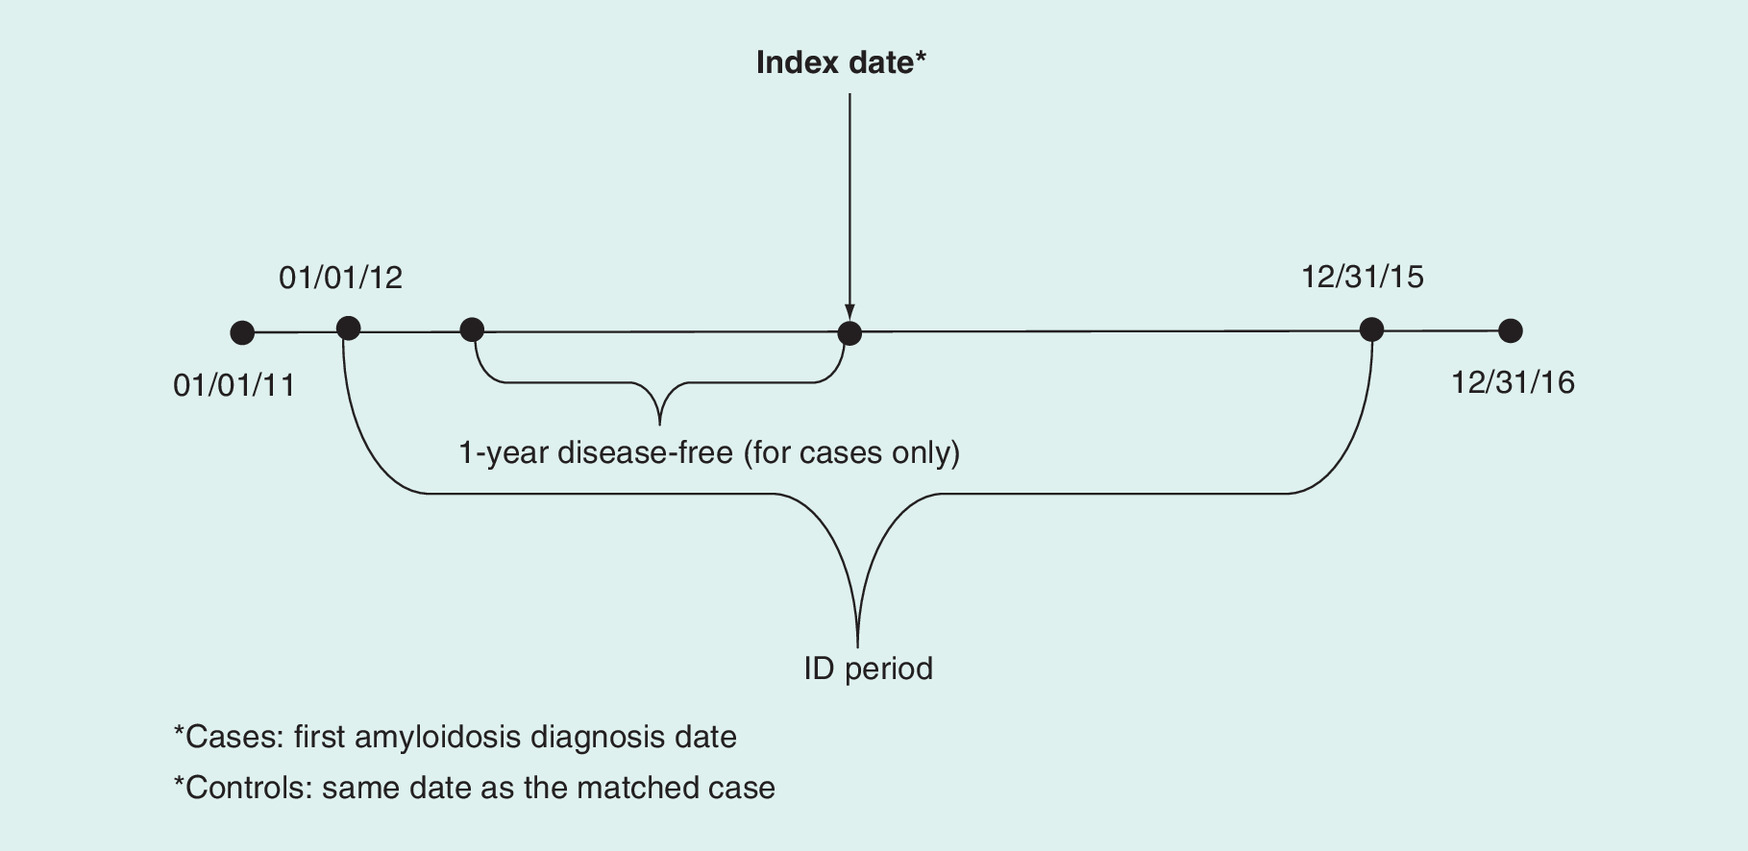
Figure 1. Study timeline for the matched case–control cohort.
*Cases: first amyloidosis diagnosis date.
*Controls: same date as the matched case
ID: Identification.
Study measures & statistical analysis
Patient demographic & clinical characteristics
For cases and controls, we reported the patient demographic and clinical characteristics during baseline (1-year period prior to the index date). Patient demographic and clinical characteristics included age, gender, geographic region, Charlson Comorbidity Index (CCI) [17], presence of multiple myeloma (ICD-9-CM: 203.0x; ICD-10-CM: C90.0x), monoclonal gammopathy of undetermined significance (MGUS; ICD-9-CM: 273.1X; ICD-10-CM: D47.2x), hypothyroidism (ICD-9-CM: 244.0x, 244.1x, 244.8x, 244.9x; ICD-10-CM: E03.1x, E03.8x, E03.9x, E89.0x), Waldenström's macroglobulinemia (ICD-9-CM: 273.3x; ICD-10-CM: C88.0x), hypotension (ICD-9-CM: 458.xx; ICD-10-CM: I95.xx), hyperlipidemia (ICD-9-CM: 272.0x-272.4x; ICD-10-CM: E78.0x-E78.5x), carpal tunnel syndrome (ICD-9-CM: 354.0x; ICD-10-CM: G56.00, G56.01, G56.02, G56.03) and end-stage renal disease (ICD-9-CM: 585.6, 996.81, V42.0, V45.1, V56.0, V56.1, V56.2, V56.3, V56.31, V56.32, V56.8, E879.1; ICD-10-CM: N18.9, T86.10-T86.13, T86.19; HCPCS: 90935, 90937, 90940, 90945, 90947, 90951-90970, 90989, 90993, 90997, 90999). Presence of these clinical characteristics was determined based upon having at least one claim with a relevant ICD-9/ICD-10/HCPCS code.
Mortality & healthcare costs
For cases and controls, we reported death rates overall in the 1-year follow-up period and time-to-death over the entire follow-up. We reported total costs and the following cost components for cases and controls in the 1-year follow-up period: inpatient hospitalization; skilled nursing facilities; hospice; ED; and non-ED outpatient service, which included costs from non-ED outpatient hospitals, home health agencies, noninstitutional providers and durable medical equipment. Services not covered by Medicare insurance were not included.
Statistical analysis
Descriptive statistics including means, standard deviations and relative frequencies and percentages for continuous and categorical data, respectively, were reported, stratified by case versus control status. T-tests and Chi-square tests for continuous and categorical variables, respectively, were performed. Additionally, to calculate time to mortality, Kaplan–Meier survival analysis was performed. Cost estimates were converted to 2016 (the final year of the study) US dollars using the Consumer Price Index to adjust for inflation. All data transformations and statistical analyses were performed using SAS© version 9.4 (SAS Institute Inc., NC, USA).
Results
Patient demographic characteristics & comorbidities
In the 2011–2016 data from the 5% Medicare LDS, 249 (33.3%) newly diagnosed AL amyloidosis Medicare beneficiaries were identified and matched to 747 (66.7%) disease-free controls. As shown in Table 1, 2566 patients had at least one inpatient or two outpatient claims for AL amyloidosis between 01/01/2012 and 12/31/2016, with the first diagnosis date occurring during the ID period (01/01/2012–12/31/2015). Of those 2566 patients, 2220 patients had no AL amyloidosis diagnosis in the baseline (1-year disease free) period; 460 patients received an AL amyloidosis treatment within 90 days of the index date; 279 patients were continuously enrolled during baseline in a qualified health plan and were continuously enrolled for at least 1 year following the index date (except those who died within 1 year). This left 249 patients with AL amyloidosis who were 66 or older in the study.
| Step/definition | n |
|---|---|
| A. No. of patients with at least one inpatient claim or two outpatient claims for AL amyloidosis diagnosis† in any position in inpatient hospital, outpatient hospital or carrier files between 01/01/2012 and 12/31/16 with the first diagnosis date (index date) occurred during ID period (1/1/2012–12/31/2015) among CMS LDS databases | 2566 |
| B. Of A, no. of patients who had no AL amyloidosis diagnoses in baseline period (1 year prior to the index date) | 2220 |
| C. Of B, no. of patients who received an AL amyloidosis treatment‡ (covered by Part A or Part B plan) within 90 days prior to or any time on or after index date within study period | 460 |
| D. Of C, no. of patients who were continuously enrolled in baseline with qualified plan (Part A and Part B with fee-for-service plan) | 289 |
| E. Of D, no. of patients who were continuously enrolled for at least 1 year since index date (except died within 1 year) with qualified plan | 279 (55 died within 1 year; 21 [8%] with ESRD§) |
| F. Of E, no. of patients who were 66 or older | 249¶ |
†International Classification of Diseases, 9th Revision, Clinical Modification (ICD-9-CM) codes: 277.30 or 277.39 or International Classification of Diseases, 10th Revision, Clinical Modification (ICD-10-CM) codes: E85.4x, E85.8x (excluding E85.82) or E85.9x.
‡HSCT, injectable drugs, or oral prescription drugs covered under Medicare parts A or B.
§With Medicare status as aged with ESRD, disabled with ESRD, or ESRD only at index.
¶Final sample of newly diagnosed AL amyloidosis patients in this study.
AL: Immunoglobulin light-chain; CMS: Centres for Medicare and Medicaid Services; ESRD: End-stage renal disease; HSCT: Hematopoietic stem cell transplant; LDS: Limited data set.
The mean (SD) age of newly diagnosed AL amyloidosis beneficiaries and disease-free controls was 76 (6.2) years; 41.8% of both newly diagnosed AL amyloidosis beneficiaries and disease-free controls were female; all US regions were represented; and the majority (90.4%) of both newly diagnosed AL amyloidosis beneficiaries and disease-free controls were white. Significantly more newly diagnosed AL amyloidosis beneficiaries were over 65 years old with end-stage renal disease compared with disease-free controls (6.0 vs 0.8%; p < 0.001). Enrollment length (from index date to the end of enrollment in the qualified health plan or study end [12/31/2016]) was significantly shorter in newly diagnosed AL amyloidosis beneficiaries than disease-free controls (mean [SD] 801 [488.0] days vs 933 [430.1] days; p < 0.001). Significantly more newly diagnosed AL amyloidosis beneficiaries died during follow-up than disease free controls (36.9 vs 15.3%; p < 0.001); and significantly more newly diagnosed AL amyloidosis beneficiaries died less than 1 year (≤364 days) after the index date than disease free controls (19.7 vs 5.4%; p < 0.001; Table 2).
| Variables | Newly diagnosed AL amyloidosis patients | Matched disease-free controls | All | p-value |
|---|---|---|---|---|
| n (%) | 249 (33.3%) | 747 (66.7%) | 996 (100%) | |
| Age, year†, mean (SD) | 76 (6.2) | 76 (6.2) | 76 (6.2) | n/a |
| 66–74 | 124 (49.8) | 372 (49.8) | 496 (49.8) | n/a |
| 75–84 | 100 (40.2) | 300 (40.2) | 400 (40.2) | |
| 85+ | 25 (10.0) | 75 (10.0) | 100 (10.0) | |
| Female†, no. (%) | 104 (41.8) | 312 (41.8) | 416 (41.8) | n/a |
| Region†, no. (%) | 50 | 150 | 200 | n/a |
| Midwest | (20.1) | (20.1) | (20.1) | |
| Northeast | 47 (18.9) | 141 (18.9) | 188 (18.9) | |
| South | 111 (44.6) | 333 (44.6) | 444 (44.6) | |
| West | 41 (16.5) | 123 (16.5) | 164 (16.5) | |
| Race†, no. (%) | 225 | 675 | 900 | n/a |
| White | (90.4) | (90.4) | (90.4) | |
| Black | 19 (7.6) | 57 (7.6) | 76 (7.6) | |
| Other/unknown | 15 (2.0) | 20 (2.0) | ||
| CMS status, no. (%) | 234 | 741 | 975 | < 0.001 |
| Aged without ESRD | (94.0) | (99.2) | (97.9) | |
| Aged with ESRD | 15 (6.0) | |||
| Days of follow-up (from index date to end of enrollment of qualified plan or study end [12/31/2016]), mean (SD) [Median] | 801 (488.0) [762] | 933 (430.1) [890] | 900 (448.7) [867] | < 0.001 |
| Died during follow-up, no. (%) | 92 (36.9) | 114 (15.3) | 206 (20.7) | < 0.001 |
| Died less than 1 year after index date, no. (%) | 49 (19.7) | 40 (5.4) | 89 (8.9) | < 0.001 |
†Disease-free controls were matched with cases in a 3:1 ratio based on age, gender, race and geographic location.
Note: Some cells suppressed to comply with CMS cell size suppression policy.
AL: Immunoglobulin light chain; CMS: Centers for Medicare and Medicaid Services; ESRD: End-stage renal disease; SD: Standard deviation.
Individuals with AL amyloidosis had a substantial burden of comorbidities or concurrent conditions, as determined by having at least one claim with a relevant ICD-9/ICD-10 code. The mean (SD) of CCI in AL amyloidosis patients was 5.0 (3.6) compared with 2.1 (2.5) in disease-free controls. Common individual comorbidities in the CCI in AL amyloidosis patients were congestive heart failure (36.1% in AL amyloidosis patients compared with 11.2% in controls), cerebrovascular disease (27.7%; 16.1%), chronic pulmonary disease (37.8%; 22.5%), moderate or severe liver disease (29.7%; 10.2%), renal disease (35.7%; 13.8%), diabetes without chronic complications (42.6%; 29.2%) and malignancy/lymphoma/leukemia (35.7%; 15.1%). Furthermore, hypothyroidism (cases: 32.1%; controls: 22.2%) and hyperlipidemia (77.5%; 65.6%) were common among newly diagnosed AL amyloidosis beneficiaries (Table 3).
| Variables | Newly diagnosed AL amyloidosis patients | Matched disease-free controls | All | p-value |
|---|---|---|---|---|
| n | 249 | 747 | 996 | |
| Charlson comorbidity index, mean (SD) (Median) | 5.0 (3.6) [4] | 2.1 (2.5) [1] | 2.9 (3.1) [2] | < 0.001 |
| Myocardial infarction, no. (%) | 37 (14.9) | 40 (5.4) | 77 (7.7) | < 0.001 |
| Congestive heart failure, no. (%) | 90 (36.1) | 84 (11.2) | 174 (17.5) | < 0.001 |
| Peripheral vascular disease, no. (%) | 35 (14.1) | 83 (11.1) | 118 (11.8) | 0.213 |
| Cerebrovascular disease, no. (%) | 69 (27.7) | 120 (16.1) | 189 (19.0) | < 0.001 |
| Dementia, no. (%) | 19 (2.5) | 25 (2.5) | 0.907 | |
| Chronic pulmonary disease, no. (%) | 94 (37.8) | 168 (22.5) | 262 (26.3) | < 0.001 |
| Rheumatologic disease, no. (%) | 24 (9.6) | 28 (3.7) | 52 (5.2) | < 0.001 |
| Peptic ulcer disease, no. (%) | 14 (1.9) | 24 (2.4) | 0.056 | |
| Mild liver disease, no. (%) | 14 (1.4) | 0.351 | ||
| Moderate or severe liver disease, no. (%) | 74 (29.7) | 76 (10.2) | 150 (15.1) | < 0.001 |
| Renal disease, no. (%) | 89 (35.7) | 103 (13.8) | 192 (19.3) | < 0.001 |
| Diabetes without chronic complications, no. (%) | 106 (42.6) | 218 (29.2) | 324 (32.5) | < 0.001 |
| Diabetes with chronic complications, no. (%) | 44 (17.7) | 59 (7.9) | 103 (10.3) | < 0.001 |
| Malignancy/lymphoma/leukemia, no. (%) | 89 (35.7) | 113 (15.1) | 202 (20.3) | < 0.001 |
| Metastatic solid tumor, no. (%) | 15 (6.0) | 21 (2.1) | < 0.001 | |
| Multiple myeloma, no. (%) | 37 (14.9) | 0 (0.0) | 37 (3.7) | < 0.001 |
| Monoclonal gammopathy of undetermined significance, no. (%) | 34 (13.7) | 37 (3.7) | < 0.001 | |
| Hypothyroidism, no. (%) | 80 (32.1) | 166 (22.2) | 246 (24.7) | 0.002 |
| Waldenström's macroglobulinemia, no. (%) | < 0.001 | |||
| Carpal tunnel syndrome, no. (%) | 23 (9.2) | 15 (2.0) | 38 (3.8) | < 0.001 |
| Malignancy/lymphoma/leukemia, excluding multiple myeloma, no. (%) | 67 (26.9) | 113 (15.1) | 180 (18.1) | < 0.001 |
| Hypotension, no. (%) | 45 (18.1) | 34 (4.6) | 79 (7.9) | < 0.001 |
| Hyperlipidemia, no. (%) | 193 (77.5) | 490 (65.6) | 683 (68.6) | < 0.001 |
| End stage renal disease† , no. (%) | 14 (5.6) | 24 (2.4) | < 0.001 |
†ICD-9-CM diagnosis code: 585.6, 996.81, V42.0, V45.1, V56.0, V56.1, V56.2, V56.3, V56.31, V56.32, V56.8, E879.1; ICD-10-CM diagnosis code: N18.9, T86.10-T86.13, T86.19; HCPCS: 90935, 90937, 90940, 90945, 90947, 90951-90970, 90989, 90993, 90997, 90999
Some cells suppressed to comply with CMS cell size suppression policy. Bold font represents variables of particular interest.
Mortality
Based on the Kaplan–Meier survival analysis, 3 months after the index date, 7.6% of newly diagnosed AL amyloidosis beneficiaries had died compared with 1.2% of disease-free controls. 6 months after the index date, 13.7% of newly diagnosed AL amyloidosis beneficiaries had died compared with 2.7% of disease-free controls. One year (≤365 days) after the index date, 19.7% of newly diagnosed AL amyloidosis beneficiaries had died compared with 5.5% of disease-free controls. 18 months after the index date, 26.6 and 8.2% of newly diagnosed AL amyloidosis beneficiaries and disease-free controls had died, respectively. 2 years after the index date, 30.6 and 11.8% of newly diagnosed AL amyloidosis beneficiaries and disease-free controls had died, respectively (all p < 0.001; Figure 2; Table 4).
| Group | At 3 months | At 6 months | At 12 months | At 18 months | At 24 months | |
|---|---|---|---|---|---|---|
| Matched controls | CDI (95% CI) | 1.2% (0.6%–2.3%) | 2.7% (1.7%–4.1%) | 5.5% (4.1%–7.4%) | 8.2% (6.4%–10.4%) | 11.8% (9.6%–14.5%) |
| # of enrollees at risk | 738 | 727 | 707 | 583 | 460 | |
| AL amyloidosis patients | CDI (95% CI) | 7.6% (4.9%–11.7%) | 13.7% (10.0%–18.6%) | 19.7% (15.3%–25.2%) | 26.6% (21.5%–32.6%) | 30.6% (25.1%–37.0%) |
| # of enrollees at risk | 230 | 215 | 200 | 157 | 100 |
AL: Immunoglobulin light chain; CDI: Cumulative death incidence.
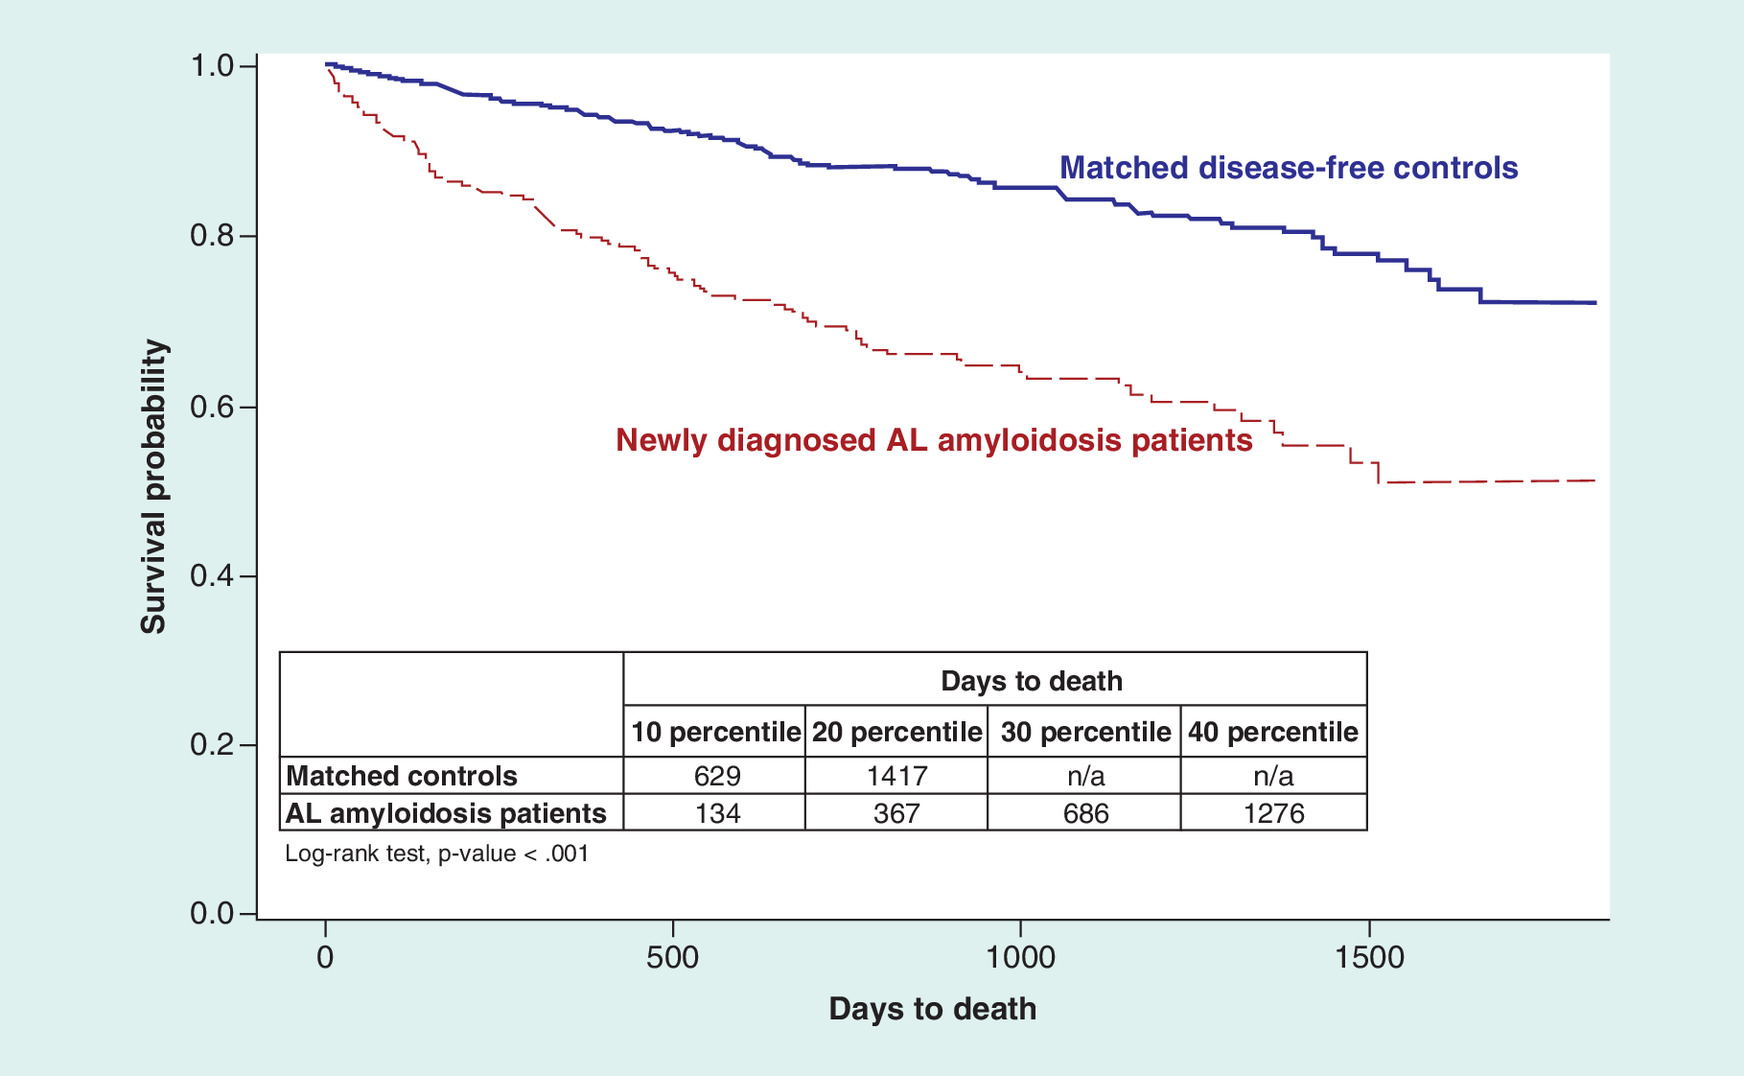
Figure 2. Time to death.
a Cumulative Death Incidence.
AL: Immunoglobulin light chain.
Healthcare Costs
Mean (SD) total annual all-cause Part A and Part B healthcare costs in the 1-year follow-up period were statistically significantly higher (p < 0.001) in newly diagnosed AL amyloidosis beneficiaries than in disease-free controls ($71,040 [65,766] vs $13,722 [27,493]). The majority of total costs among newly diagnosed AL amyloidosis beneficiaries accrued from inpatient hospital costs ($28,126 [40,409]) and non-ED outpatient service costs (mean [SD] $37,137 [37,363]; Table 5).
| Costs | Newly diagnosed AL amyloidosis patients | Matched disease-free controls | All | p-value |
|---|---|---|---|---|
| n | 249 | 747 | 996 | – |
| Post 1 year total costs (Part A and Part B coverage), mean (SD) | $71,040 (65,766) | $13,722 (27,493) | $28,051 (47,554) | < 0.001 |
| Inpatient hospital costs | $28,126 (40,409) | $4768 (15,872) | $10,608 (26,425) | < 0.001 |
| Skilled nurse facility costs | $4423 (13,130) | $1142 (5,943) | $1962 (8,454) | < 0.001 |
| Hospice costs | $910 (3,945) | $263 (2,044) | $424 (2,662) | 0.014 |
| ED costs | $443 (897) | $193 (659) | $256 (733) | < 0.001 |
| Non-ED outpatient service costs | $37,137 (37,363) | $7355 (11,284) | $14,801 (24,696) | < 0.001 |
†All patients, except those who died within 1 year, had at least 1 year of follow-up.
AL: Immunoglobulin light chain; ED: Emergency department; SD: Standard deviation.
Discussion
Using data that are nationally representative of Medicare beneficiaries, we found that almost 20% of newly diagnosed AL amyloidosis beneficiaries died within 1 year of diagnosis, while 5.5% of age, gender, race and geographic region-matched disease-free controls died in the 1-year follow-up period. Healthcare costs for Medicare Part A and Part B were a mean of $71,040 for newly diagnosed AL amyloidosis beneficiaries compared with $13,722 for disease-free controls in the 1-year follow-up period. The present study provides information about incremental mortality and healthcare costs associated with AL amyloidosis in the year following diagnosis in a real-world setting. Our study indicates that individuals with newly diagnosed AL amyloidosis have a substantial burden of comorbidities. Several of the observed conditions, including congestive heart failure, renal disease and liver disease, likely represent manifestations of the AL amyloidosis disease process.
Mortality
Death within 1 year after the index date was almost four-times higher in newly diagnosed AL amyloidosis beneficiaries than disease-free beneficiaries. To date, no studies have provided nationally representative data on survival in Medicare beneficiaries with newly diagnosed AL amyloidosis. However, several European and clinical studies have examined survival in these patients. For example, in a Swedish population-based study that used the nationwide Swedish Patient Registry, Weiss et al. (2016) found that 30% of patients diagnosed with AL amyloidosis between 2010 and 2013 died within 1 year of diagnosis; and 39% of patients died within two years [6]. A study by Muchtar et al. on patients with AL amyloidosis diagnosed and seen at Mayo Clinic between 2010 and 2014 found a 2-year death rate of 40% [18]. These death rates are higher than those in our analysis likely due to differences in patient populations and data used, as patients seen at the Mayo Clinic are probably sicker than average Medicare patients with AL amyloidosis.
The mortality rate found in our study may be lower than those found in other studies because patients whose disease is so far progressed that they do not receive treatment are excluded from our study.
Healthcare costs
The incremental cost of AL amyloidosis is very high. In the 1-year follow-up period, healthcare costs were more than five times higher in AL amyloidosis beneficiaries than in disease-free beneficiaries. To date, no studies have provided nationally representative data on healthcare costs in Medicare beneficiaries with newly diagnosed AL amyloidosis. However, in a study by Hari et al. that used administrative claims data on adult patients with relapsed/refractory AL amyloidosis, total average healthcare costs in the 1 year following AL amyloidosis relapse or refractory state were $139,143. The authors state that these costs were similar to those for newly diagnosed AL amyloidosis patients, but the exact cost is not provided [19]. Patients in the Hari et al. study differed from those included in our study because patients with relapsed/refractory AL amyloidosis lived long enough to receive a second line of treatment. In comparison, Quock et al. performed a study on newly diagnosed AL amyloidosis patients ≥18 years old using Truven MarketScan® Commercial and Medicare Supplement Databases (Truven Health Analytics, MI, USA) and found a mean total cost of $122,180 in the 1-year post-diagnosis period [10]. The average cost found in this previous study may be higher than what we found in the current study because we were unable to include costs associated with prescription drugs covered by Medicare Part D in the current study due to lack of access to these data. For example, in the Quock et al. study, mean total outpatient pharmacy costs for all prevalent AL amyloidosis patients between 2007 and 2015 were $13,054; if these pharmacy costs were not included in this previous study, mean total costs would have been similar to those found in the current study [10].
Study limitations
This study has limitations. First, there is no diagnosis code in ICD-9-CM or ICD-10-CM specific to AL amyloidosis and no generally accepted or clinically validated method for identifying this condition using health insurance claims data; the codes for this study were selected with clinical expert input to eliminate as many non-AL amyloid patients as possible (e.g., by excluding 277.31, familial Mediterranean fever and E85.3, secondary systemic amyloidosis). We further required patients to have received treatment consistent with expert recommendations for AL amyloidosis. This requirement would be expected to decrease the sensitivity but increase the specificity of our identification algorithm. Nonetheless, patients with transthyretin-related hereditary amyloidosis would likely still have been included in our sample. We are planning to validate the algorithm we used in a future study using data collected from medical records. Second, the administrative claims used in this study were collected for reimbursement purposes and the completeness and accuracy of medical coding is subject to data coding restrictions and data entry error. Third, presence of comorbidities was determined based upon having at least one claim with a relevant ICD-9/ICD-10 code, not a clinical diagnosis, so misclassification, diagnostic uncertainty or coding errors were possible. Fourth, the healthcare cost estimates may be underestimated as claims for patients who die outside of the hospital were not available, and services not covered by insurance or rendered ‘out-of-network’ were not included. Fifth, cost estimates include direct healthcare costs only, and do not take into account important indirect costs associated with caregiver burden, loss of productivity or reduced quality of life. Sixth, we did not match based upon clinical factors, such as cardiovascular disease, as the goal of our study is to describe the incremental burden of illness AL amyloidosis patients face compared with population-based, disease-free controls. We would expect that patients with amyloidosis would have many more comorbid illnesses than matched controls. If we matched by comorbidity, we would be unable to estimate the burden of the disease, as the comparison group would (because of matching) have an abnormally high burden of disease for their age. Lastly, due to lack of access to Part D data, patients treated with prescription drugs covered under Part D were not included in our study. However, we plan to replicate the study using the Medicare 100% data file, which includes Part D data, in the near future.
Conclusion
In summary, this analysis shows that among newly diagnosed AL amyloidosis Medicare beneficiaries, about 20% die within 1 year of diagnosis; and a mean of $71,040 is spent for Part A and Part B coverage in the 1 year following diagnosis.
This study is the first to provide a comprehensive report of the real-world mortality and healthcare costs associated with AL amyloidosis in a US Medicare population with newly diagnosed AL amyloidosis.
Future perspective
With a rapid aging population and increasing prevalence of AL amyloidosis, the number of Medicare beneficiaries with the disease is expected to increase over the coming years. Despite its high mortality and high burden of disease, AL amyloidosis is under-diagnosed. Awareness is essential for timely detection and treatment of AL amyloidosis. The hope of new therapies on the horizon may also offer opportunities to enhance the survival and reduce the burden of the disease.
Background
Current estimates suggest that at least 12,000 adults are affected by immunoglobulin light chain (AL) amyloidosis in the USA, and this number may rise, as an increasing prevalence rate was observed in our previous study with claims data.
The disease predominantly affects older adults, many of which are Medicare beneficiaries. With rapid population aging and increasing prevalence of AL amyloidosis, the number of Medicare beneficiaries with the disease will likely rise in the future.
We sought to examine time to death, death rates and healthcare costs in the 1 year following diagnosis among Medicare beneficiaries with newly diagnosed AL amyloidosis.
Methods
We used 2011–2016 data from the 5% Medicare Limited Data Set for this retrospective, matched case–control study.
The study population was comprised of the following two cohorts of Medicare beneficiaries: newly diagnosed AL amyloidosis beneficiaries, and matched, disease-free beneficiaries.
For cases and controls, we reported the patient demographic and clinical measures during baseline (1-year period prior to the index date), mortality during the entire follow-up period and healthcare cost measures during the 1-year follow-up period.
Results
A total of 249 (33.3%) cases were matched to 747 (66.7%) controls. 19.7% of cases died within 1 year of follow-up versus 5.5% of controls; 30.6 vs 11.8% died within 2 years (p < 0.001). Mean (SD) costs in 1-year of follow-up were significantly higher among cases versus controls ($71,040 [65,766] vs $13,722 [27,493]; p < 0.001).
Conclusion
In summary, this analysis shows that among newly diagnosed AL amyloidosis Medicare beneficiaries about 20% die within 1 year of diagnosis; and a mean of $71,040 is spent for Part A and Part B coverage in the 1 year following diagnosis.
This study is the first to provide a comprehensive report of the real-world mortality and healthcare costs associated with AL amyloidosis in a US Medicare population with newly diagnosed AL amyloidosis.
Acknowledgments
The authors would like to thank MS Broder for providing feedback on early drafts of this manuscript.
Authors’ contributions
All authors were equally involved in the design of the study. E Chang conducted the statistical analyses and all authors contributed equally in the interpretation of results and writing of the manuscript.
Financial & competing interests disclosure
Quock is an employee of Prothena Biosciences Inc., which funded the research described in this manuscript. D'Souza is an employee of the Medical College of Wisconsin and was paid by Prothena Biosciences Inc. to consult as a subject matter expert. Chang, Yan, Munday, and Gokhale are employees of Partnership for Health Analytic Research, LLC, which received funding from Prothena Biosciences Inc. to conduct the research described in this manuscript. The authors have no other relevant affiliations or financial involvement with any organization or entity with a financial interest in or financial conflict with the subject matter or materials discussed in the manuscript apart from those disclosed.
No writing assistance was utilized in the production of this manuscript.
Ethical conduct of research
The authors state that they have obtained appropriate institutional review board approval or have followed the principles outlined in the Declaration of Helsinki for all human or animal experimental investigations. In addition, for investigations involving human subjects, informed consent has been obtained from the participants involved.
References
Papers of special note have been highlighted as: • of interest; •• of considerable interest
1.
Mathews WH. Primary systemic amyloidosis. Am. J. Med. Sci. 228(3), 317–333 (1954).
2.
Palladini G, Merlini G. What is new in diagnosis and management of light chain amyloidosis? Blood 128(2), 159–168 (2016).
3.
Merlini G. AL amyloidosis: from molecular mechanisms to targeted therapies. Hematol. Am. Soc. Hematol. Educ. Program. 2017(1), 1–12 (2017).
4.
Quock TP, Yan JT, Chang E et al. Epidemiology of AL amyloidosis in a US commercially insured population. Blood 130(Suppl. 1), 5335–5335 (2017).
5.
Fact Sheet: Aging in the United States – Population Reference Bureau [Internet]. www.prb.org/aging-unitedstates-fact-sheet/.
6.
Weiss BM, Lund SH, Bjorkholm M et al. Improved survival in AL amyloidosis: a population-based study on 1,430 patients diagnosed in Sweden 1995–2013. Blood 128(22), 4448–4448 (2016).
•• Shows improved survival over time in Swedish patients, which is helpful when interpreting mortality data on US Medicare patients.
7.
Janssen S, Van Rijswijk MH, Meijer S, Ruinen L, Van der Hem GK. Systemic amyloidosis: a clinical survey of 144 cases. Neth. J. Med. 29(11), 376–385 (1986).
8.
Kyle RA, Linos A, Beard CM et al. Incidence and natural history of primary systemic amyloidosis in Olmsted County, Minnesota, 1950 through 1989. Blood 79(7), 1817–1822 (1992).
• This was the original epidemiology study of amyloidosis in the USA.
9.
Kyle RA, Gertz MA. Primary systemic amyloidosis: clinical and laboratory features in 474 cases. Semin. Hematol. 32(1), 45–59 (1995).
10.
Quock TP, Yan T, Chang E et al. Healthcare resource utilization and costs in amyloid light-chain amyloidosis: a real-world study using US claims data. J. Comp. Eff. Res. 7(6), 549–559 (2018).
•• Understanding healthcare costs in commercially insured patients is important given that there are no published data on costs in Medicare patients specifically.
11.
Rapezzi C, Merlini G, Quarta CC et al. Systemic cardiac amyloidoses: disease profiles and clinical courses of the 3 main types. Circulation 120(13), 1203–1212 (2009).
12.
Weber N, Mollee P, Augustson B et al. Management of systemic AL amyloidosis: recommendations of the Myeloma Foundation of Australia Medical and Scientific Advisory Group. Intern. Med. J. 45(4), 371–382 (2015).
13.
Wechalekar AD, Gillmore JD, Bird J et al. Guidelines on the management of AL amyloidosis. Br. J. Haematol. 168(2), 186–206 (2015).
14.
Nienhuis HLA, Bijzet J, Hazenberg BPC. The prevalence and management of systemic amyloidosis in Western countries. Kidney Dis. 2(1), 10–19 (2016).
15.
Wechalekar AD, Whelan C. Encouraging impact of doxycycline on early mortality in cardiac light chain (AL) amyloidosis. Blood Cancer J. 7(3), e546 (2017).
16.
NCCN Clinical Practice Guidelines in Oncology (NCCN Guidelines): Systemic Light Chain Amyloidosis. NCCN.
• NCCN guidelines provide an understanding of practice guidelines to make sense of the costs associated with recommended treatments.
17.
Charlson ME, Pompei P, Ales KL et al. A new method of classifying prognostic comorbidity in longitudinal studies: development and validation. J. Chronic Dis. 40(5), 373–383 (1987).
18.
Muchtar E, Gertz MA, Kumar SK et al. Improved outcomes for newly diagnosed AL amyloidosis between 2000 and 2014: cracking the glass ceiling of early death. Blood 129(15), 2111–2119 (2017).
•• It is important to understand mortality rates over time and how treatments have improved survival in AL amyloidosis.
19.
Hari P, Lin HM, Asche CV et al. Treatment patterns and health care resource utilization among patients with relapsed/refractory systemic light chain amyloidosis. Amyloid 25(1), 1–7 (2018).
•• Understanding health care resource utilization and treatment patterns in a specific AL patient population is helpful when interpreting cost data on Medicare patients.
Information & Authors
Information
Published In
Copyright
© 2018 Future Medicine Ltd.
History
Received: 5 July 2018
Accepted: 3 September 2018
Published online: 25 October 2018
Keywords:
Topics
Authors
Metrics & Citations
Metrics
Article Usage
Article usage data only available from February 2023. Historical article usage data, showing the number of article downloads, is available upon request.
Citations
How to Cite
Mortality and healthcare costs in Medicare beneficiaries with AL amyloidosis. (2018) Journal of Comparative Effectiveness Research. DOI: 10.2217/cer-2018-0062
Export citation
Select the citation format you wish to export for this article or chapter.
Citing Literature
- Alvin Hu, Raad B. Chowdhury, Giada Bianchi, Pathogenesis and kidney prognosis of renal amyloidosis, Cellular and Molecular Life Sciences, 10.1007/s00018-025-06030-y, 83, 1, (2026).
- Blake Angell, Siyuan Wang, Thomas Gadsden, Monica Moorthy, Charu Malik, Jonathan Barratt, Olivier Devuyst, Ifeoma I. Ulasi, Daniel P. Gale, Agnivo Sengupta, Anna Palagyi, Vivekanand Jha, Stephen Jan, Scoping Review of Economic Analyses of Rare Kidney Diseases, Kidney International Reports, 10.1016/j.ekir.2024.09.004, 9, 12, (3553-3569), (2024).
- Kamleshun Ramphul, Jasninder S. Dhaliwal, Gagandeep S. Arora, Renuka Verma, Hemamalini Sakthivel, Cardiac Arrhythmias Among Patients With Amyloidosis and Valvular Disease; An Analysis Via the National Inpatient Sample, Current Problems in Cardiology, 10.1016/j.cpcardiol.2023.102000, 48, 12, (102000), (2023).
- Morie A. Gertz, Adam D. Cohen, Raymond L. Comenzo, Efstathios Kastritis, Heather J. Landau, Edward N. Libby, Michaela Liedtke, Vaishali Sanchorawala, Stefan Schönland, Ashutosh Wechalekar, Jeffrey A. Zonder, Giovanni Palladini, Jackie Walling, Spencer Guthrie, Christie Nie, Carol Karp, Yuying Jin, Gene G. Kinney, Giampaolo Merlini, Birtamimab plus standard of care in light-chain amyloidosis: the phase 3 randomized placebo-controlled VITAL trial, Blood, 10.1182/blood.2022019406, 142, 14, (1208-1218), (2023).
- Zhenyue Fu, Jiayu Lv, Xiya Gao, Bingxuan Zhang, Yumeng Li, Xia Xu, Haoran Zheng, Huaqin Wu, Qingqiao Song, Research trends and hotspots evolution of cardiac amyloidosis: a bibliometric analysis from 2000 to 2022, European Journal of Medical Research, 10.1186/s40001-023-01026-5, 28, 1, (2023).
- Angela Dispenzieri, Jeffrey Zonder, James Hoffman, Sandra W. Wong, Michaela Liedtke, Rafat Abonour, Anita D’Souza, Charlene Lee, Sarah Cote, Ravi Potluri, Eric Ammann, NamPhuong Tran, Annette Lam, Sandhya Nair, Real-world treatment patterns, costs, and outcomes in patients with AL amyloidosis: analysis of the Optum EHR and commercial claims databases, Amyloid, 10.1080/13506129.2022.2137400, 30, 2, (161-168), (2022).
- Charlene Lee, Annette Lam, Teresa Kangappaden, Pyper Olver, Sarah Kane, Diana Tran, Eric Ammann, Systematic literature review of evidence in amyloid light-chain amyloidosis, Journal of Comparative Effectiveness Research, 10.2217/cer-2021-0261, 11, 6, (451-472), (2022).
- Anita D’Souza, Brooke E. Magnus, Judith Myers, Angela Dispenzieri, Kathryn E. Flynn, The use of PROMIS patient-reported outcomes (PROs) to inform light chain (AL) amyloid disease severity at diagnosis, Amyloid, 10.1080/13506129.2020.1713743, 27, 2, (111-118), (2020).