Clinical and economic benefits of advanced microplegia delivery system in cardiac surgery: evidence from 250 hospitals
Abstract
Aim: Determine the impact of a second generation microplegia delivery system (MPS2) compared with traditional cardioplegia. Materials & methods: Multivariable difference-in-differences analysis using fixed effects was performed for each outcome: adverse event (AE) composite, total visit cost, medication cost, length of stay (LOS) and intensive care unit (ICU) days. Results: A 2.25% absolute risk reduction in AE composite was found with MPS2 compared with traditional cardioplegia, which equates to relative risk reduction of 5.25%. Significant reductions in LOS and ICU days (0.1 α level). Per case reduction of US$1231 total visit and US$192 medication costs were found in MPS2 hospitals. Conclusion: For hospitals with MPS2, significant reductions were seen in AEs, LOS and ICU days, which lead to reductions in total visit and medication costs.
In general, cardioplegic solutions help to arrest the heart to allow for a motionless field to perform coronary bypass grafting or open heart surgery, and to prevent myocardial injury by reducing oxygen demand to below 10% [1]. Myocardial injury can be caused by ischemia or reperfusion injury and a small decrease in myocardial function may lead to increased morbidity and mortality. Furthermore, myocardial edema can result in postoperative dysfunction and complications [2]. The use of microplegia has been shown to reduce postoperative cardiac edema, increase buffering and permit more rapid recovery of ventricular function [3]. Blood cardioplegia has superior oxygen carrying capacity, better osmotic properties and antioxidant capability [4].
The Quest Myocardial Protection System is used by perfusionists to deliver whole blood (from an arterial blood source) and/or cardioplegia solutions to the heart, during various cardiac surgeries on either an arrested or beating heart. Several clinical studies have shown that the elimination of diluent provides substantive clinical benefits, however, there is limited evidence examining the benefits of this second generation technology compared with traditional cardioplegia (TC) in the real-world setting where choice is influenced by availability, internal hospital protocols and purchasing agreements, and physician/technician preference [1,3–6].
Therefore, the objective of this study was to conduct a retrospective observational study using real world evidence from Premier hospitals across the USA to determine the clinical and economic affect to the hospital for using a second generation microplegia delivery system (MPS2) compared with TC, in patients undergoing cardiac surgery.
Materials & methods
Data source
The Premier Healthcare Database was used as the data source for this study. This database contains data from more than 580 million patient visits, or one in every five discharges in the nation [7]. The Premier database contains data from standard hospital discharge files, including a patient's demographic and disease state, and information on billed services, including medications, laboratory, diagnostics and therapeutic services in de-identified patient daily service records. In addition, information on hospital characteristics, including geographic location, bed size and teaching status, is also available. Comparisons between patient and hospital characteristics for the hospitals that submit data to Premier and those of the probability sample of hospitals and patients selected for the National Hospital Discharge Survey suggested that the patient populations are similar with regard to patient age, gender, length of stay (LOS), mortality, primary discharge diagnosis and primary procedure groups [8].
All data used to perform this analysis were de-identified and accessed in compliance with the Health Insurance Portability and Accountability Act. As a retrospective analysis of a de-identified database, the research was exempt from IRB review under 45 CFR 46.101(b)(4).
Inclusion criteria & cohort definitions
The study population for this analysis was any inpatient hospital visit in the Premier database from 1 January 2009 through 31 March 2015 with a record of an International Classification of Diseases (ICD-9) primary procedure code for one or more of the following cardiac surgeries: coronary artery bypass graft (CABG), aortic valve replacement (AVR) and mitral valve replacement (MVR) surgeries. CABG, AVR and MVR were analyzed together, as these procedures are the principal indications for use of cardiopulmonary bypass and cardioplegia in adult patients [9]. See Supplementary File A for a listing of all ICD-9 procedure codes of interest. It was possible for patient visits to have more than one procedure at a time; the first procedure code of interest was taken for each patient.
Patient visits meeting this inclusion criteria were then divided into two separate cohorts: those patient visits at hospitals that employ the MPS2 system (treatment) versus those that do not (control). For ‘treatment’ hospitals, all patient visits were further subdivided into visits that occurred before and after the corresponding hospital employed the MPS2 system. Patient visits were excluded from ‘treatment’ hospitals if they occur during a 3 month ‘wash out’ period when a hospital was initiating the MPS2 system into their cardiac surgical protocol.
Statistical analyses
The unit of analysis for this research was the inpatient visit. This database does not allow for longitudinal follow-up of patients unless the visits occurred at the same hospital. Both clinical (composite adverse event [AE] end point) and economic outcomes (cost and LOS) were analyzed.
Clinical events were identified as an AE if there was a record of the event during the hospitalization and the event was not recorded as present on admission. The composite AE outcome was defined as one or more of the following events recorded using ICD-9 diagnosis codes: major cardiac or renal event (including: acute kidney injury with and without dialysis, acute myocardial infarction, angina, stent occlusion/thrombosis, stroke and transient ischemic attack), sepsis or other infection, wound complication, abdominal complication, pulmonary complication, cardiogenic shock, bleeding or death. A complete variable listing with corresponding ICD-9 diagnosis codes for each clinical event included in the AE composite outcome is located in Supplementary File B. A composite clinical outcome was chosen as the primary safety end point for this analysis as a patient-level measure of the serious AE rate. Combining events into a single patient-level end point helps bolster the statistical power for demonstrating any significant difference in the overall safety signal between cohorts.
Economic outcome variables included: total cost in dollars to the hospital for the inpatient visit of interest, total cost in dollars to the hospital for all medications administered during the inpatient visit of interest LOS in days and days spent in the intensive care unit (ICU days).
Key independent variables of interest included hospital use of the MPS2 system and the type of cardiac surgery being performed: CABG, AVR or MVR. The choice to make type of surgery an independent variable in the model as opposed to running separate models for each surgery type allows us to explore the relationship between type of surgery and the MPS2 system while maintaining statistical power. Covariates of interest included: patient demographics (age, race, marital status, region and insurance); patient comorbidities (diabetes, hypertension, etc.) including the Charlson Comorbidity Index; primary diagnosis or reason for hospitalization; and patient risk scores (All Patient Refined Diagnosis Related Group [DRG] severity of illness [SOI] and risk of mortality [ROM] scores).
The Charlson Comorbidity Index is the most common used prognostic measure of illness burden in clinical research. It has been cited in nearly 7000 studies [10]. The Charlson Comorbidity Index assigns a score based on comorbid condition and age. Another measure of risk used in this analysis was the risk of severity and mortality scores based on the 3M All Patient Refined DRG (All Patent Refined DRGs) Classification System [11]. This index is a widely adopted proprietary risk adjustment classification tool, which uses information from routine claims data to produce valid and reliable severity measurement and risk adjustment scores. It is used to account for differences related to the patients’ SOI or ROM in large datasets. SOI refers to the extent of physiologic decompensation or organ system loss of function. ROM refers to the likelihood of dying. The SOI and ROM indices each categorize patients into minor, moderate, major or extreme [12].
Prior to multivariable modeling, summary statistics were generated by treatment (hospitals before and after the MPS2 system) and control (hospitals that never employed the MPS2 system) for the following variable categories: patient visit demographics, comorbidities and surgical characteristics.
Multivariable models
The methodology for this research was the difference-in-differences (DID) technique, frequently used in economics and health services research, to measure the change induced by a particular treatment or event, in this case, the hospital's use of the MPS2 system. A multivariable DID analysis using fixed effects was performed for each outcome of interest (overall AE composite, total costs, medication costs, LOS and ICU days). The hospital fixed-effect specification was chosen because it controls for time-invariant hospital characteristics that are otherwise unobservable, such as specific hospital protocols. The DID allowed for the examination of the effect of hospitals’ usage of the MPS2 system by comparing patient visits undergoing cardiac surgeries using MPS2 with patient visits undergoing these surgeries in the same hospitals before the introduction of the system, as well as to patient visits undergoing these surgeries with TC. Since hospitals adopted the system in different calendar years, the ‘control’ group consisted of patient visits from hospitals who never adopted the technology and patient visits from hospitals who eventually adopted it in subsequent years. Model results are shown with progressive saturation, the final models adjusted for hospital fix effects, patient demographics, surgical characteristics (type of surgery and primary diagnosis) and comorbid conditions. All models were run using Stata Version 12.
Results
Independent variables & covariates of interest
A total of 258,479 patient visits met the initial inclusion criteria across 275 hospitals. There were 43 hospitals contributing inpatient visits that employed the MPS2 and 232 TC hospitals. Final sample size for MPS2 hospitals before implementation was 16,049 patient visits and after implementation were 29,242 patient visits. For TC hospitals the total number of patient visits was 211,523. Figure 1 displays the attrition diagram for this analysis.
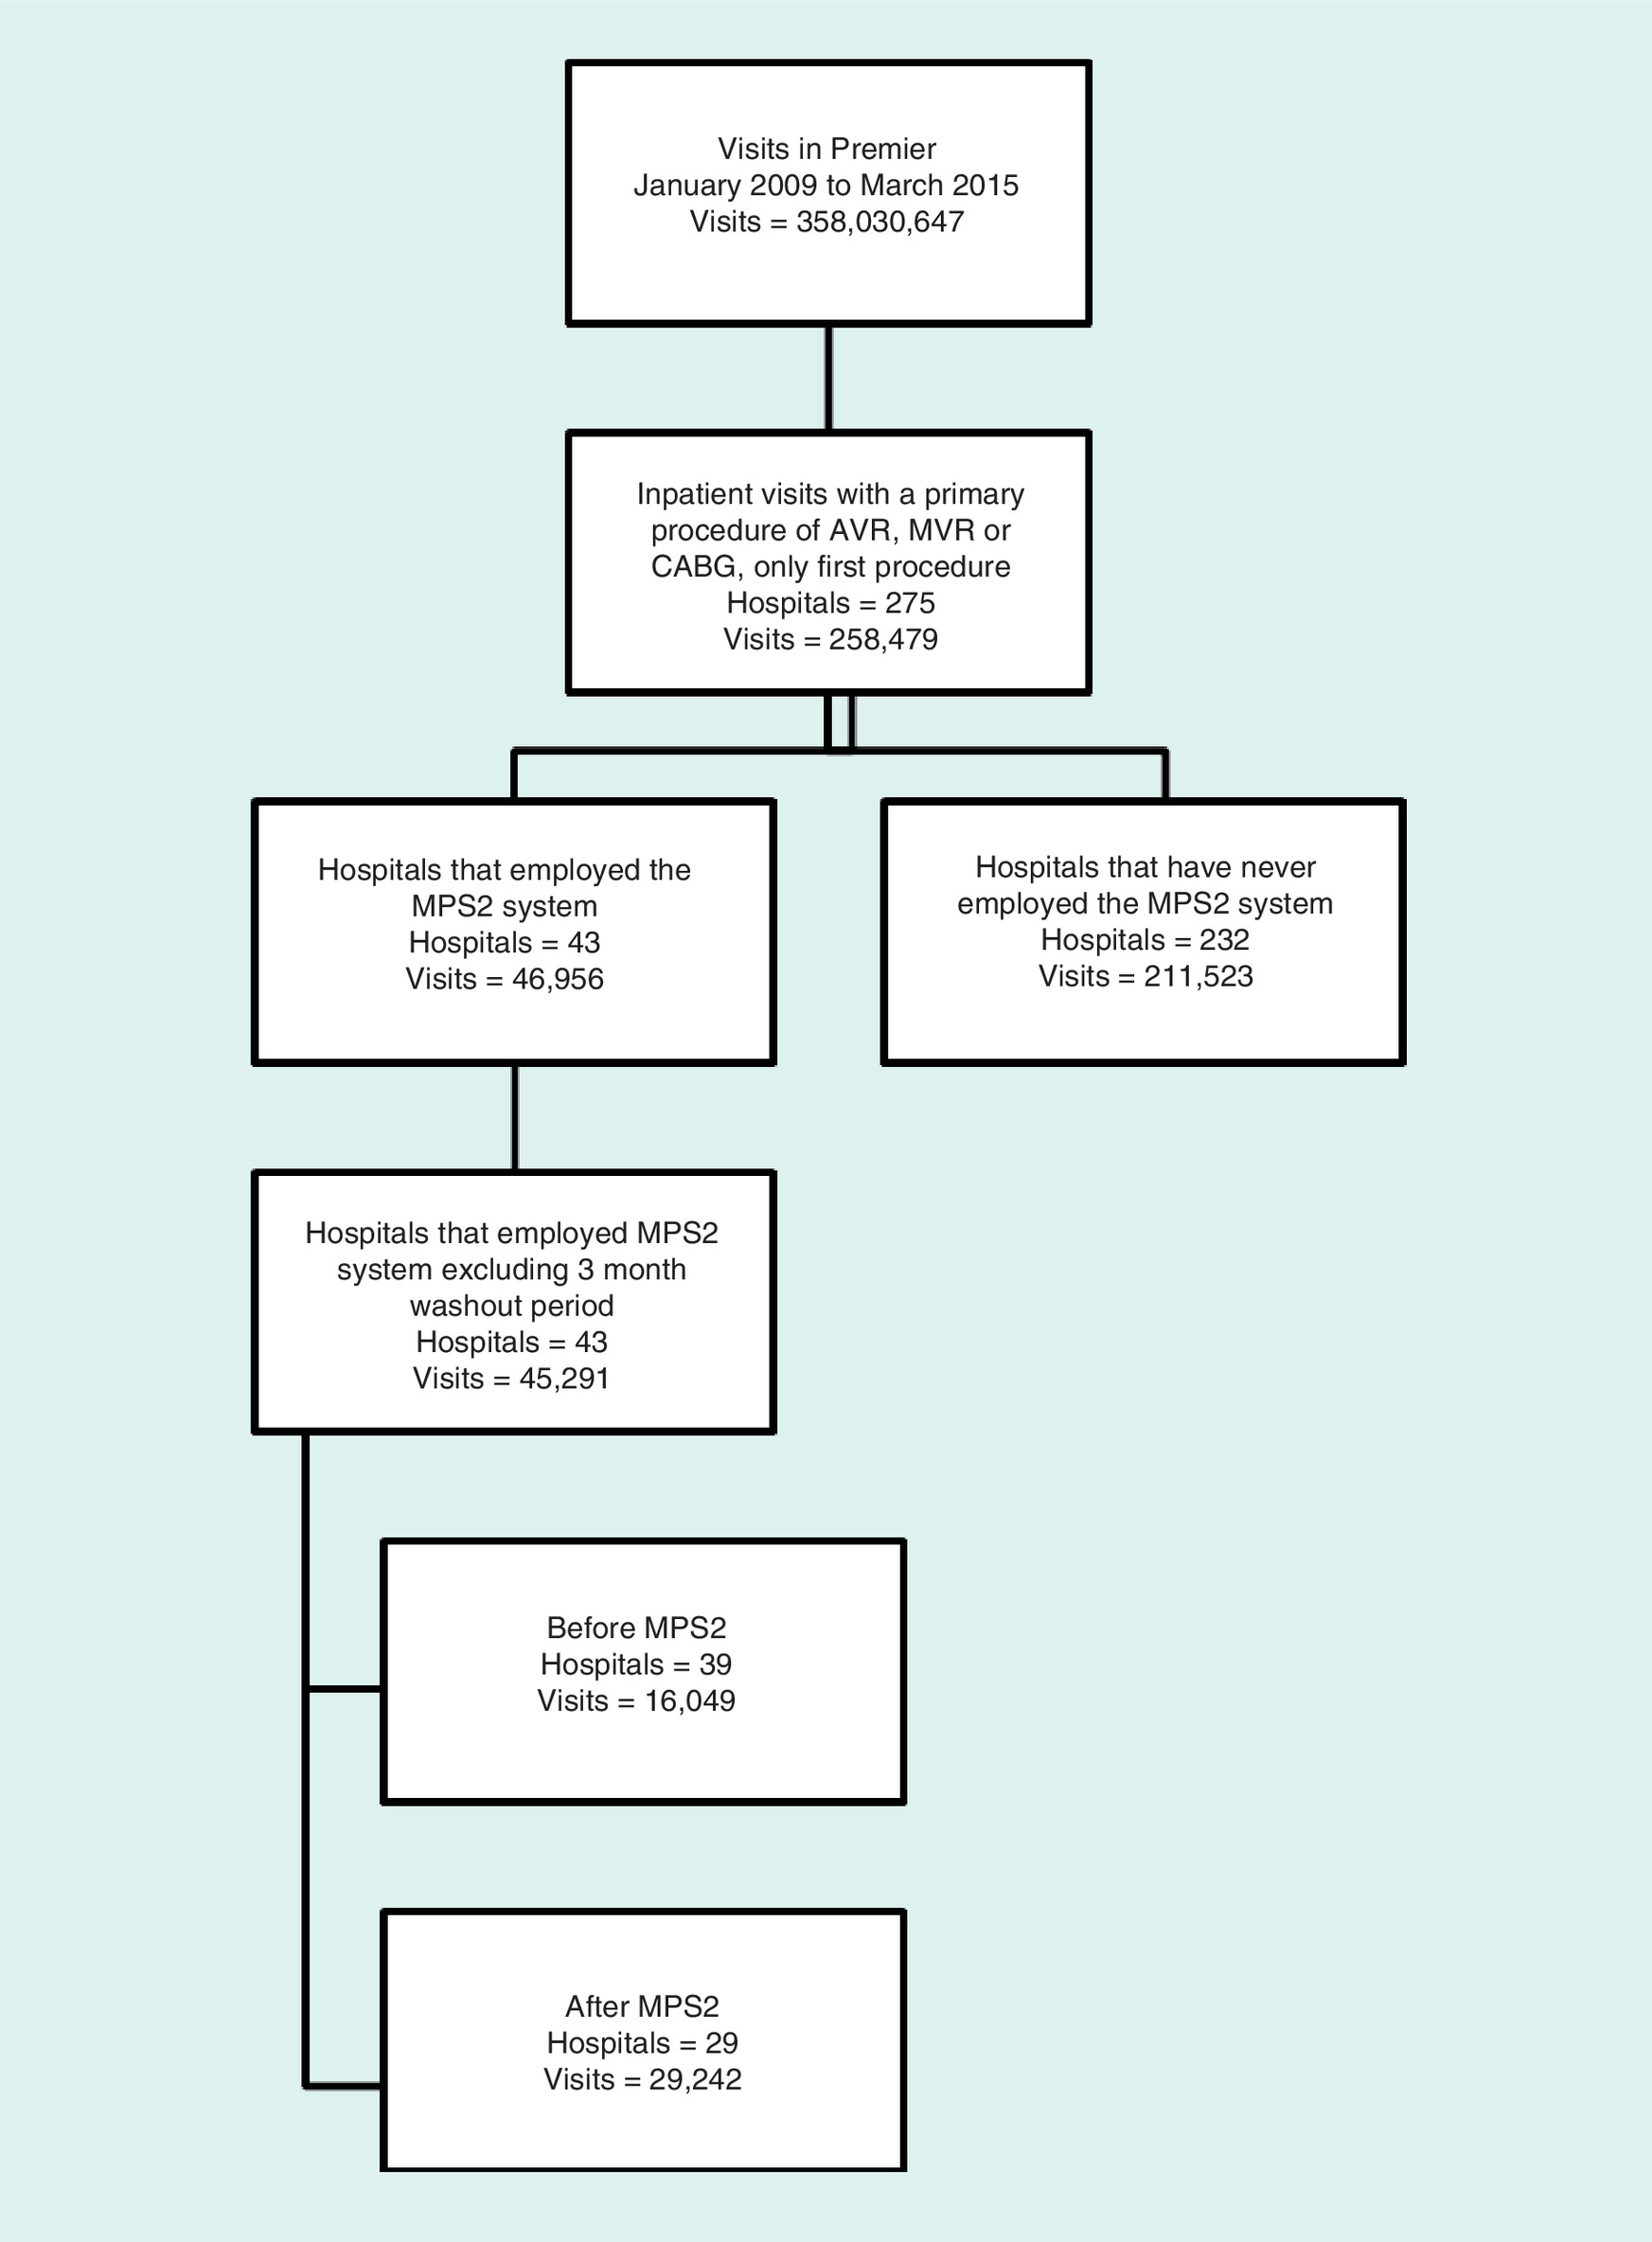
Figure 1. Attrition diagram.
AVR: Aortic valve replacement; CABG: Coronary artery bypass graft; MPS2: Microplegia delivery system; MVR: Mitral valve replacement.
Demographics were consistent across all three groups (Table 1): MPS2 hospitals before and after implementation and TC hospitals. Average age was 66 years with 68% of the patients being male. Majority of patients across all three groups were married, had Medicare as their primary insurance and were having nonurgent elective procedures.
| Demographic | TC before MPS2 | MPS2 | TC | |||
|---|---|---|---|---|---|---|
| n | % | n | % | n | % | |
| Total patient visits | 16,049 | 100 | 29,242 | 100 | 211,523 | 100 |
| Age | ||||||
| Mean | 66.1 | – | 66.2 | – | 66.3 | – |
| Std. dev. | 11.36 | – | 11.73 | – | 11.64 | – |
| Race | ||||||
| Caucasian | 12,079 | 75.3 | 24,015 | 82.1 | 151,127 | 71.5 |
| African–American | 887 | 5.5 | 2402 | 8.2 | 12,976 | 6.1 |
| Other | 3083 | 19.2 | 2825 | 9.7 | 47,420 | 22.4 |
| Gender | ||||||
| Female | 5046 | 31.4 | 9386 | 32.1 | 65,966 | 31.2 |
| Male | 11,003 | 68.6 | 19,856 | 67.9 | 145,545 | 68.8 |
| Unknown | 0 | 0.0 | 0 | 0.0 | 12 | 0.0 |
| Marital status | ||||||
| Married | 9034 | 56.3 | 16,079 | 55.0 | 114,362 | 54.1 |
| Single | 5380 | 33.5 | 9353 | 32.0 | 70,440 | 33.3 |
| Other/unknown | 1635 | 10.2 | 3810 | 13.0 | 26,721 | 12.6 |
| Insurance | ||||||
| Commercial | 1174 | 7.3 | 2035 | 7.0 | 13,501 | 6.4 |
| Medicare | 9394 | 58.5 | 17,146 | 58.6 | 122,435 | 57.9 |
| Medicaid | 918 | 5.7 | 1,722 | 5.9 | 14,133 | 6.7 |
| Other | 4563 | 28.4 | 8339 | 28.5 | 61,454 | 29.1 |
| Admission type | ||||||
| Emergency | 3651 | 22.8 | 6869 | 23.5 | 53,097 | 25.1 |
| Urgent | 3620 | 22.6 | 5426 | 18.6 | 42,662 | 20.2 |
| Elective | 8739 | 54.5 | 16,507 | 56.5 | 114,960 | 54.4 |
| Trauma center | 1 | 0.0 | 0 | 0.0 | 50 | 0.0 |
| Other/unknown | 38 | 0.2 | 440 | 1.5 | 754 | 0.4 |
| Severity of Illness status | ||||||
| Minor | 712 | 4.4 | 1349 | 4.6 | 11,558 | 5.5 |
| Moderate | 5506 | 34.3 | 10,558 | 36.1 | 79,443 | 37.6 |
| Major | 6467 | 40.3 | 11,522 | 39.4 | 82,594 | 39.1 |
| Extreme | 3364 | 21.0 | 5813 | 19.9 | 37,928 | 17.9 |
| Mortality status | ||||||
| Minor | 2909 | 18.1 | 5230 | 17.9 | 39,710 | 18.8 |
| Moderate | 5948 | 37.1 | 11,188 | 38.3 | 82,485 | 39.0 |
| Major | 4621 | 28.8 | 8375 | 28.6 | 60,509 | 28.6 |
| Extreme | 2571 | 16.0 | 4449 | 15.2 | 28,819 | 13.6 |
TC before MPS2, inpatient procedures in hospitals prior switch to MPS2.
MPS2: Microplegia delivery system; TC: Traditional cardiaoplagia.
The distribution of severity and mortality scores were also fairly consistent across the groups with the control group (TC hospitals) having the lower percentage of patients with extreme mortality (13.6%) and severity (17.9%) scores (Table 1). Charlson Comorbidity Index was consistent across the three groups with an overall average of 5.2 (Table 2). As expected among patients having CABG, AVR and MVR procedures, high rates of diabetes, heart disease, lung disease and renal disease are present across all three groups (Table 2).
| Comorbid condition | TC Before MPS2 | MPS2 | TC | |||
|---|---|---|---|---|---|---|
| n | % | n | % | n | % | |
| Total patients | 16,049 | 100 | 29,242 | 100 | 211,523 | 100 |
| Charlson Comorbidity Index | ||||||
| Mean | 5.2 | – | 5.3 | – | 5.2 | – |
| Standard deviation | 2.17 | – | 2.24 | – | 2.16 | – |
| Myocardial infarction | 5639 | 35.1 | 10,123 | 34.6 | 73,715 | 34.9 |
| Congestive heart failure | 4605 | 28.7 | 9238 | 31.6 | 62,716 | 29.7 |
| Peripheral vascular disease | 3018 | 18.8 | 5736 | 19.6 | 35,754 | 16.9 |
| Cerebrovascular disease | 1784 | 11.1 | 3464 | 11.9 | 23,092 | 10.9 |
| Dementia | 57 | 0.4 | 115 | 0.4 | 829 | 0.4 |
| Chronic pulmonary disease | 5275 | 32.9 | 9885 | 33.8 | 62,508 | 29.6 |
| Connective tissue disease/rheumatic disease | 402 | 2.5 | 757 | 2.6 | 4959 | 2.3 |
| Peptic ulcer disease | 192 | 1.2 | 299 | 1.0 | 2168 | 1.0 |
| Mild liver disease | 418 | 2.6 | 816 | 2.8 | 5575 | 2.6 |
| Diabetes without chronic complications | 5440 | 33.9 | 9932 | 34.0 | 74,430 | 35.2 |
| Diabetes with chronic complications | 960 | 6.0 | 1976 | 6.8 | 12,951 | 6.1 |
| Paraplegia and hemiplegia | 147 | 0.9 | 270 | 0.9 | 2007 | 1.0 |
| Renal disease | 2560 | 16.0 | 5500 | 18.8 | 36,667 | 17.3 |
| Cancer | 327 | 2.0 | 684 | 2.3 | 4122 | 2.0 |
| Moderate or severe liver disease | 42 | 0.3 | 94 | 0.3 | 637 | 0.3 |
| Metastatic carcinoma | 23 | 0.1 | 55 | 0.2 | 365 | 0.2 |
| AIDS/HIV | 20 | 0.1 | 24 | 0.1 | 210 | 0.1 |
TC before MPS2, inpatient procedures in hospitals prior to switch to MPS2.
MPS2: Microplegia delivery system; TC: Traditional cardiaoplagia.
The most frequently occurring primary diagnosis was coronary atherosclerosis which occurred 52.2% at MPS2 hospitals before and 46.8% after implementation and 49.0% for TC hospitals (Table 3). The distribution of CABG, AVR and MVR procedures were also consistent across the board with CABG being the most frequently occurring procedure, keeping in mind that any patient could be having more than one procedure per visit.
| Surgical characteristic | TC Before MPS2 | MPS2 | TC | |||
|---|---|---|---|---|---|---|
| n | % | n | % | n | % | |
| Total patients | 16,049 | 100 | 29,242 | 100 | 211,523 | 100 |
| Visit primary diagnosis code | ||||||
| Coronary atherosclerosis | 8369 | 52.2 | 13,689 | 46.8 | 103,534 | 49.0 |
| Valve disorder | 3936 | 24.5 | 8433 | 28.8 | 55,800 | 26.4 |
| Acute myocardial infarction | 2887 | 18.0 | 5585 | 19.1 | 41,225 | 19.5 |
| Complication of device | 253 | 1.6 | 516 | 1.8 | 3521 | 1.7 |
| Heart failure | 217 | 1.4 | 319 | 1.1 | 2423 | 1.2 |
| Aneurysm | 129 | 0.8 | 217 | 0.7 | 1327 | 0.6 |
| Arrhythmia | 58 | 0.4 | 84 | 0.3 | 750 | 0.4 |
| Angina | 12 | 0.1 | 14 | 0.1 | 116 | 0.1 |
| Other | 188 | 1.2 | 385 | 1.3 | 2827 | 1.3 |
| Primary procedure | ||||||
| CABG | 11,209 | 69.8 | 19,358 | 66.2 | 145,289 | 68.7 |
| AVR | 3969 | 24.7 | 8307 | 28.4 | 54,791 | 25.9 |
| MVR | 871 | 5.4 | 1577 | 5.4 | 11,443 | 5.4 |
TC before MPS2, inpatient procedures in hospitals prior to switch to MPS2.
AVR: Aortic valve replacement; CABG: Coronary artery bypass graft; MPS2: Microplegia delivery system; MVR: Mitral valve replacement; TC: Traditional cardiaoplagia.
Primary outcome of interest
Figure 2 displays a pie chart showing the distribution of events that make up the clinical AE event composite. Pulmonary events were the most frequently occurring category making up 48.6% of the distribution of AEs. Since patients can have more than one AE during a visit, in order to display the distribution of AEs in the pie chart, AEs are ordered by severity and only counted once.
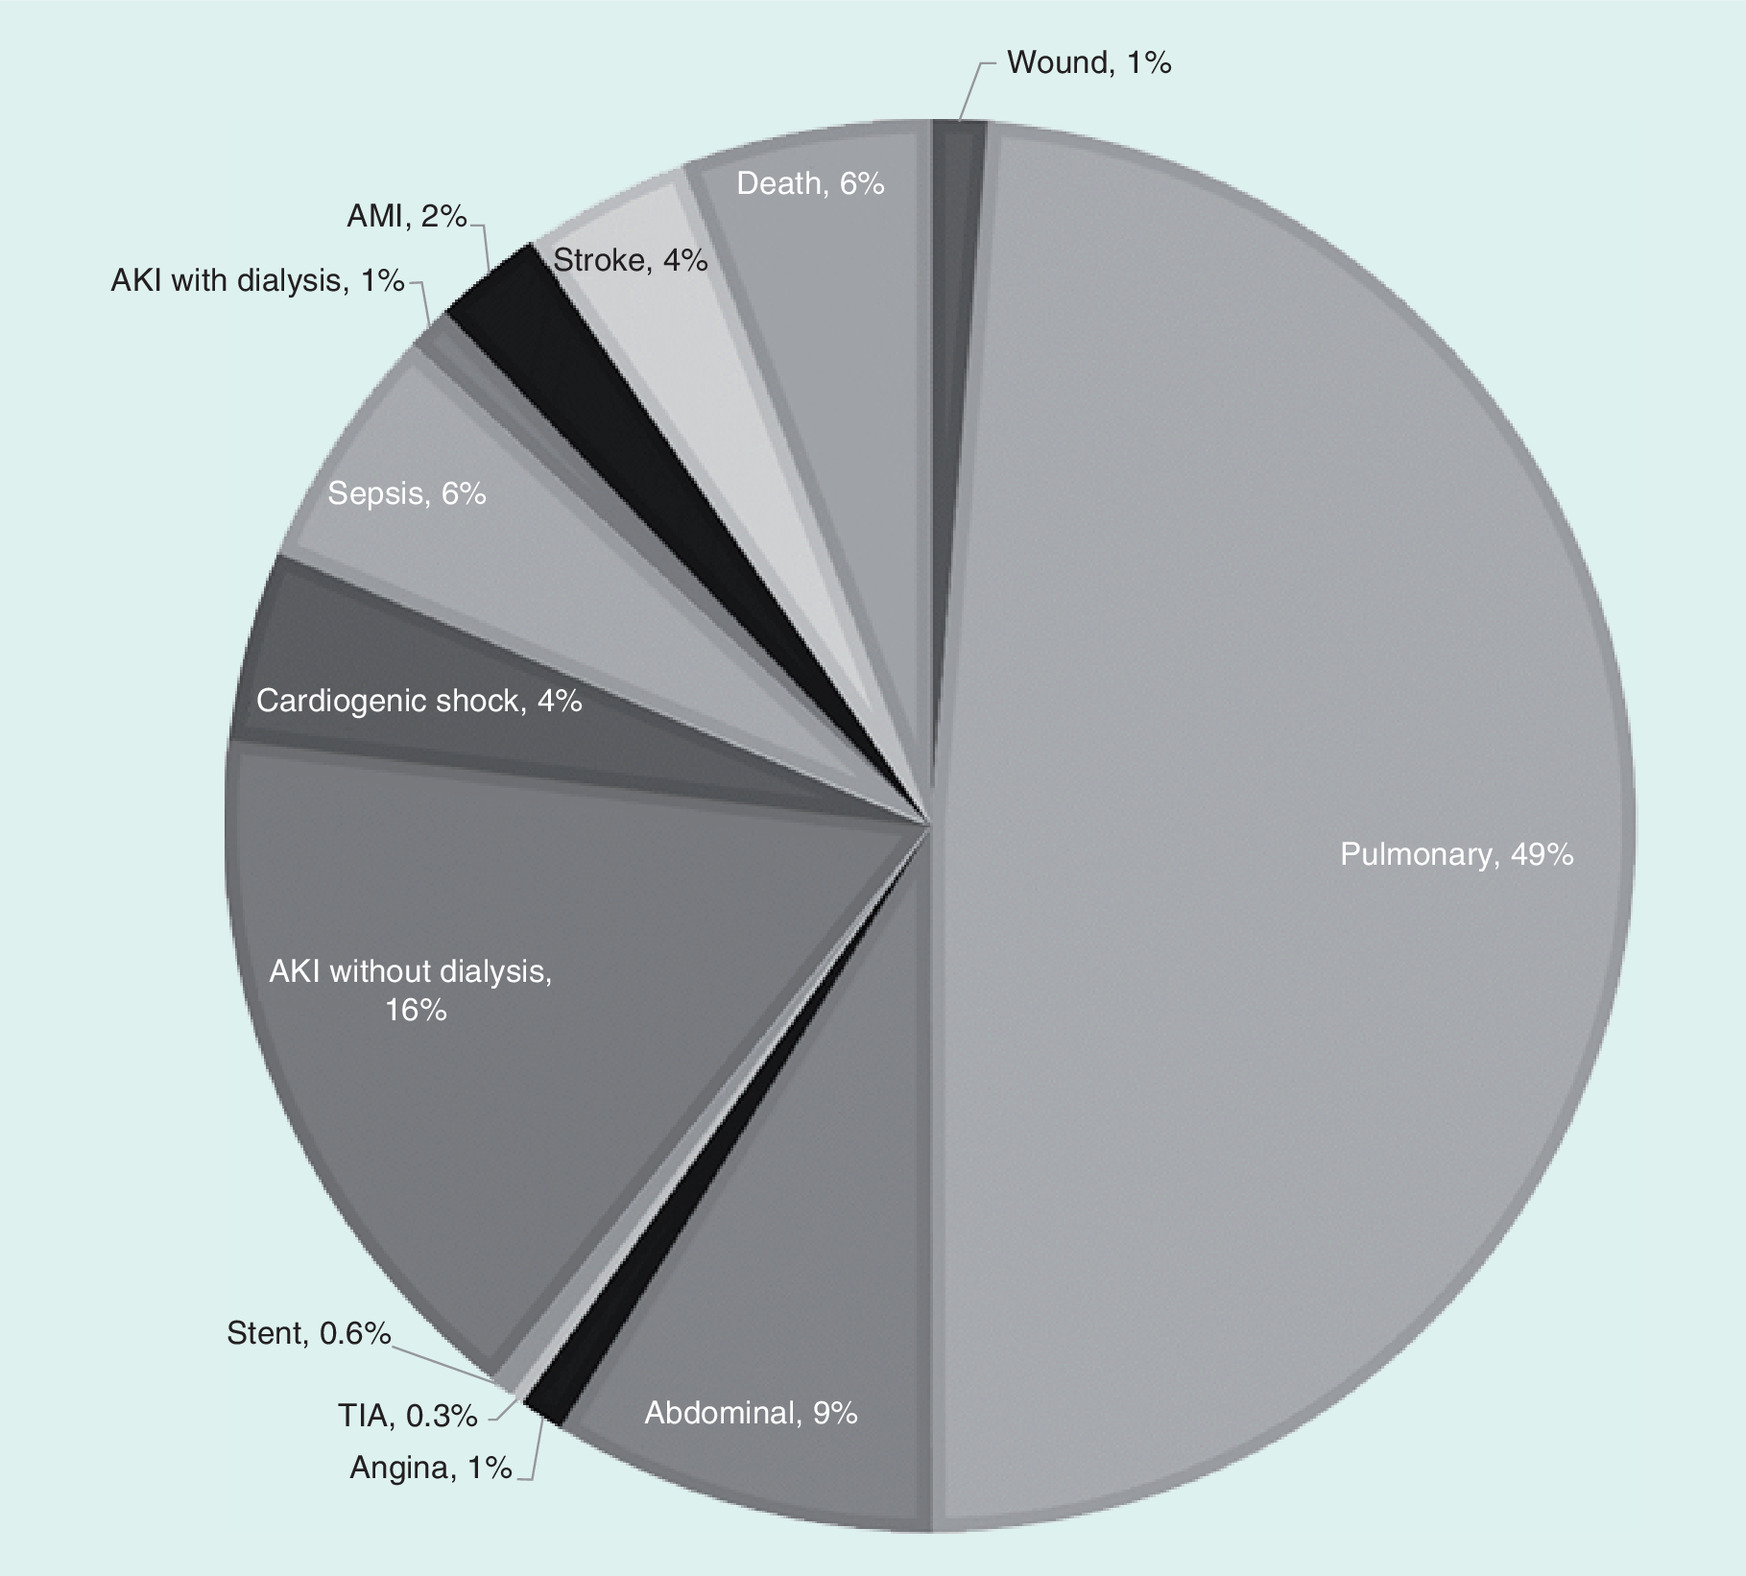
Figure 2. Adverse event composite.
AKI: Acute kidney injury; AMI: Acute myocardial infarction; TIA: Transient ischemic attack.
Multivariable results
Multivariable results of the fixed effect DID analysis for of LOS show an average of 9.75 hospital days with 2.94 ICU days for TC and 9.56 and 2.82 days, respectively for MPS2. This equates to a 0.18 reduction in overall LOS and a 0.12 reduction in ICU days for hospitals using MPS2 compared with controls (Supplementary File D). Therefore, approximately one in every five patients experienced 1 day reduction in LOS and one in every eight had a 1 day reduction in ICU days.
Modeling results from fully saturated models estimate an average total cost and medication cost for each cohort as follows: US$45,807.50 and 3571.01 for TC and US$44,576.50 and 3378.91 for MPS2. After controlling for all covariates, the differences in cost were statistically significant with a US$1231 reduction in overall hospital costs and a US$192 reduction for medication costs for MPS2 hospitals (Supplementary File E). This equates to a 2.5% absolute reduction in total costs and a 5.38% reduction in medication costs. All costs were adjusted to 2015 dollars based on consumer price index.
In the fully saturated model, Multivariable results of the fixed effect DID analysis for the AE event composite demonstrated a 2.25% reduction in overall AEs in MPS2 hospitals compared with controls. Figure 3 displays the relative risk of the AE composite at each stage of model saturation. The first bar includes only fixed effects and each subsequent bar shows the effect of additional variables. The final bar shows that after controlling for within hospital variation and all covariates (final model), there was an approximately 5.25% relative risk reduction in overall AEs.
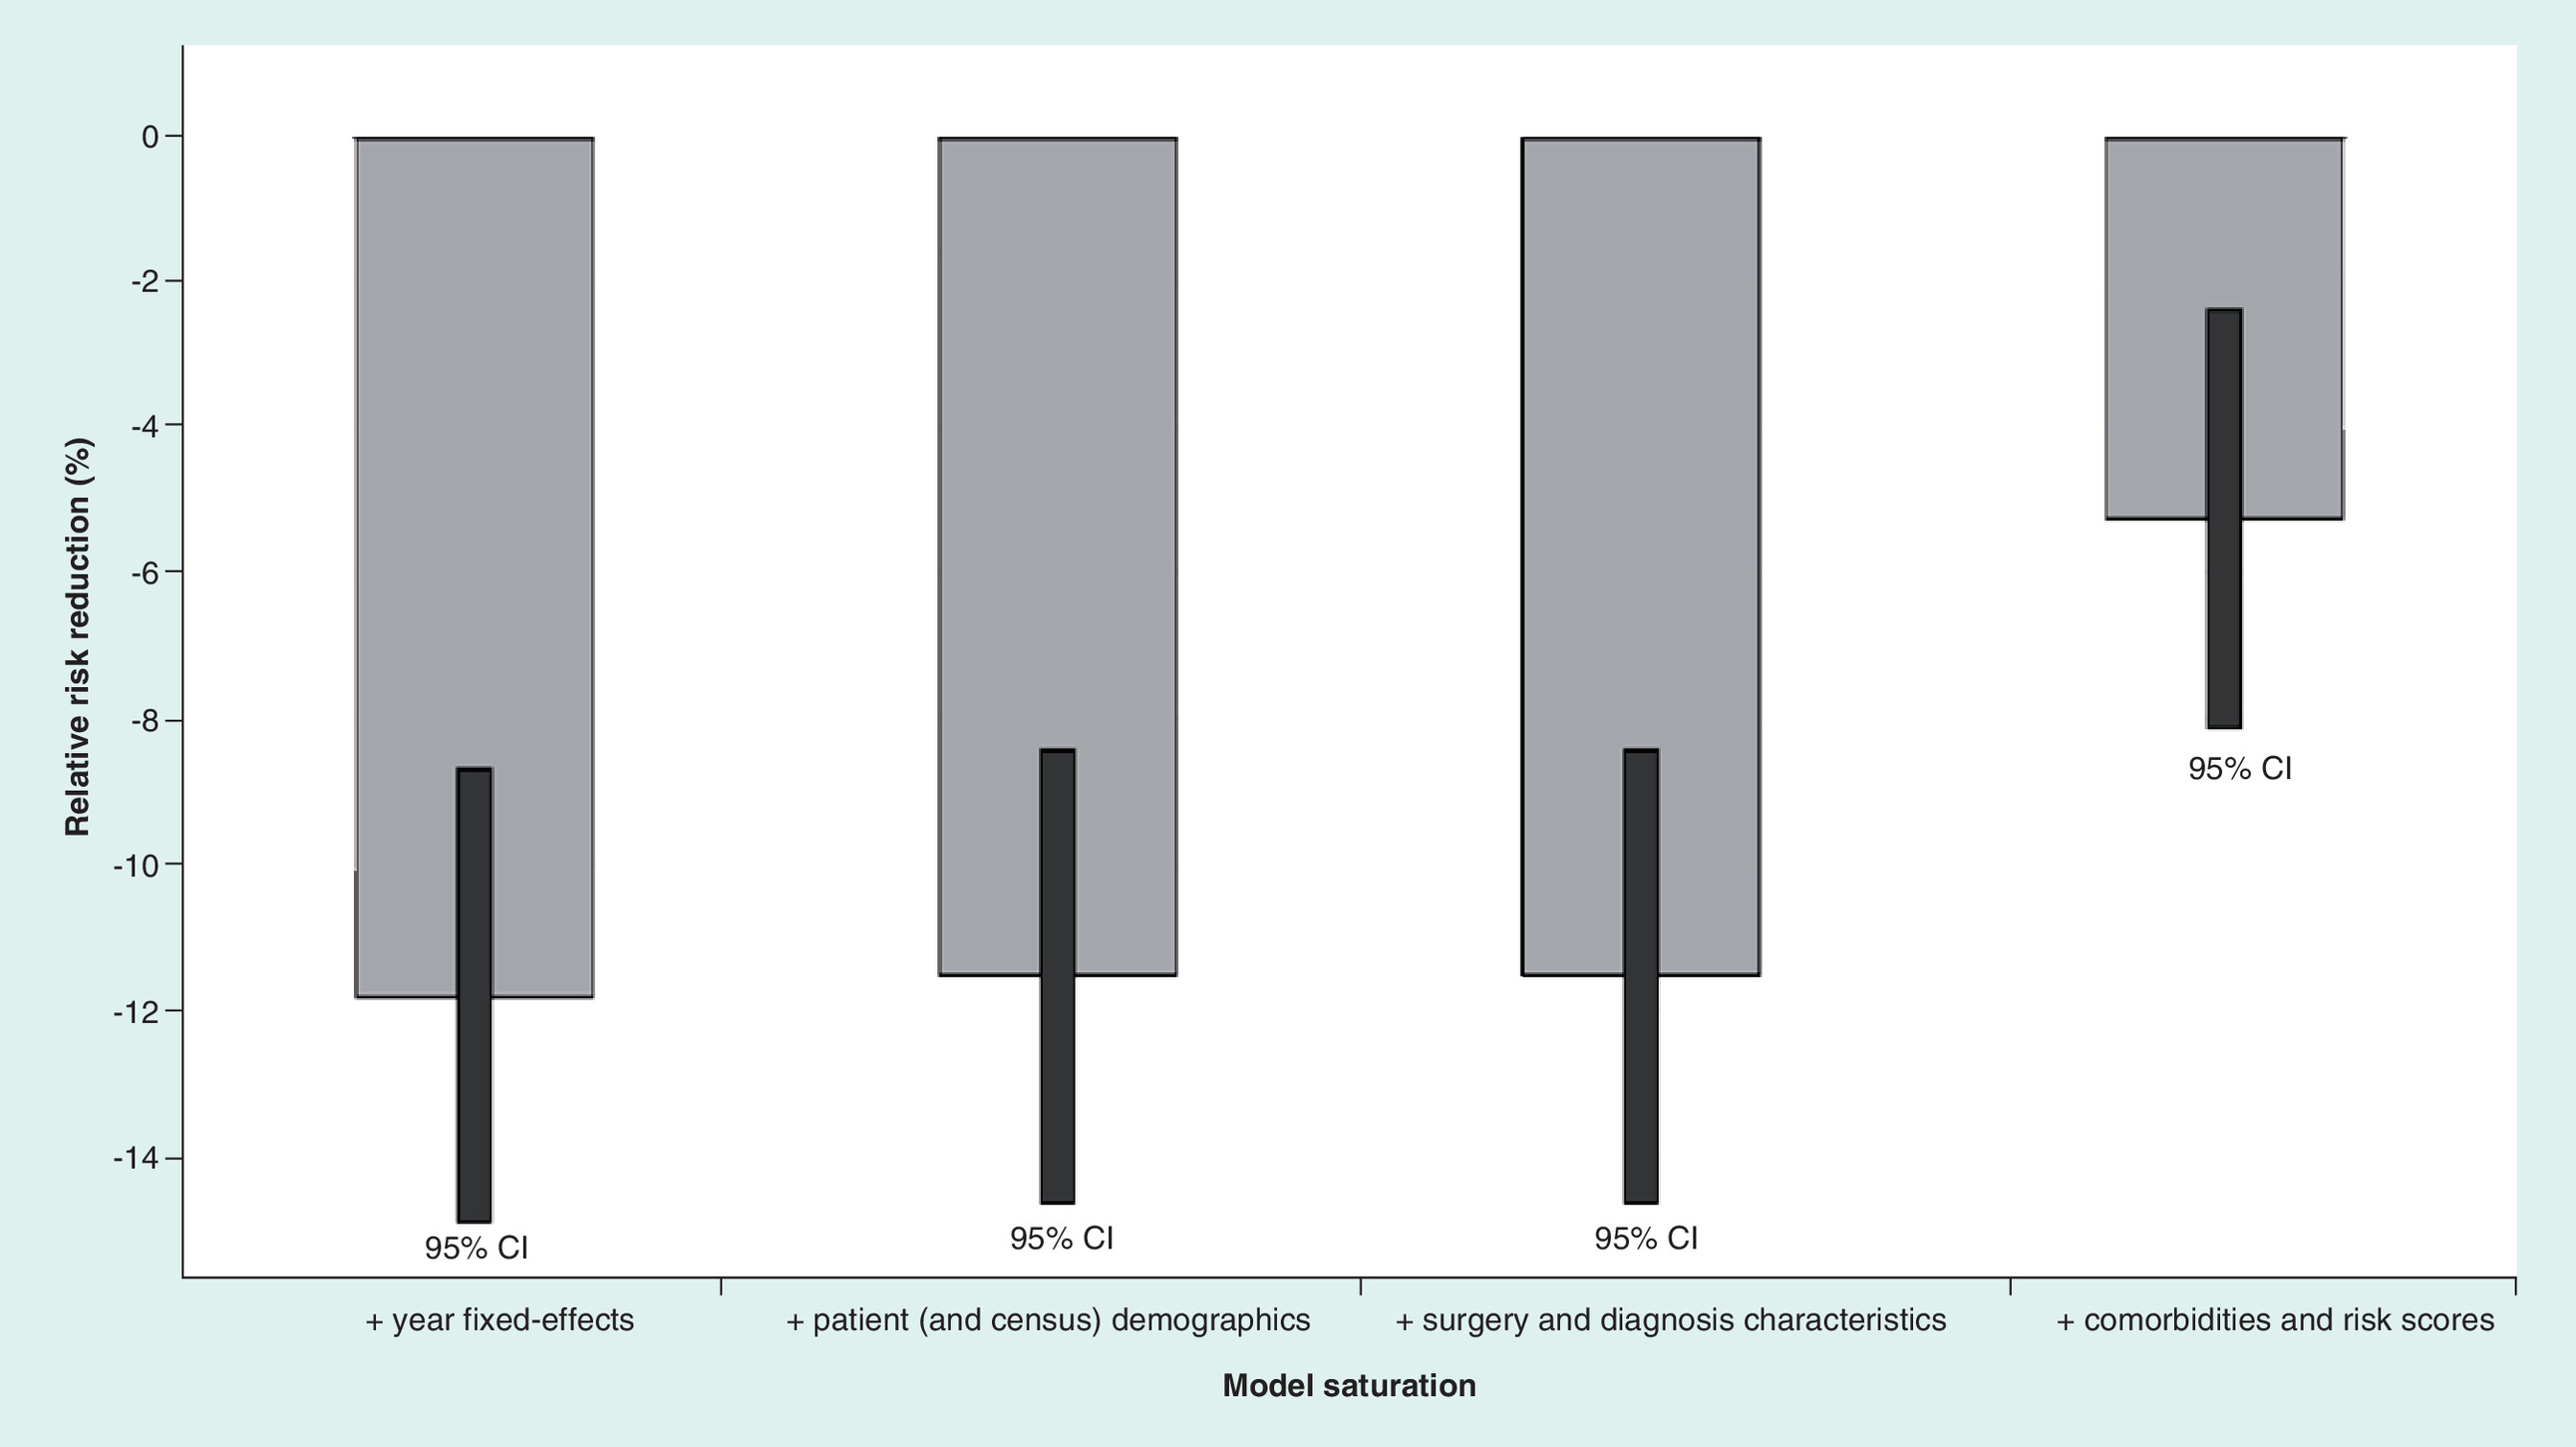
Figure 3. Multivariable results adverse event composite.
Each bar represents the results of a multivariable model estimating the relative risk reduction for the adverse event (AE) composite with increasing saturation. The first bar represents the model with only the year fixed-effects variable, the second bar is the estimate of the relative risk reduction for the AE composite with patient (and census) demographics added to the model. The third bar shows the estimate of the relative risk reduction for the AE composite with year fixed-effects, patient (and census) demographics as well as surgery and diagnosis characteristics. The fourth bar shows the fully saturated model with all of the prior variables and the addition of comorbidities and risk scores.
Discussion
This study finds significant benefits associated with the introduction of the microplegia delivery system, which include a reduction in AEs, LOS and ICU days as well as a reduction in overall and medication costs for CABG, AVR and MVR inpatient surgeries.
Use of microplegia has been associated with several clinical advantages. Both microplegia and blood cardioplegia provide cardiac protection via the delivery of oxygen, buffers and free radical scavengers to myocardial tissue [4,13]. However, through the use of specialized precision pumps, microplegia can deliver large volumes of continuous or intermittent cardioplegia with minimal administration of crystalloid solution, thereby limiting hemodilution and its deleterious effects.
On average, crystalloid solution can be reduced by 515 ml with microplegia over standard 8:1 blood cardioplegia [4]. Hemodilution and reduced hematocrit below 25% during cardiopulmonary bypass have also been associated with significant morbidity, thought to be due to poor oxygen delivery and organ ischemia [14,15]. Complications of hemodilution include: acute renal failure, stroke, need for intra-aortic balloon pump or inotropes and mortality [14–16]. The risk of hemodilution is particularly prominent in the pediatric population. To date, no studies of microplegia versus blood cardioplegia in pediatrics has been undertaken.
This analysis demonstrates a statistically significant overall reduction in AEs by 5.25% in centers that adopted MPS2. A singular cause of this reduction could not be distinguished. The inflammatory response to cardiopulmonary bypass is systemic, potentially causing dysfunction in any organ [17]. Other than a decrease in hemodilution, the initial effect of microplegia is most likely at the myocardium. More rapid recovery of cardiac function, with less need for inotropes and/or intra-aortic balloon pump may result in improved organ perfusion, less renal injury and quicker mobilization. The composite impact of the switch to MPS2 may materialize as a reduction pulmonary events. Nearly half of reported AEs were pulmonary in nature. Pulmonary events included: pneumonia, atelectasis, respiratory failure and insufficiency, pleural effusion, pneumothorax, air leak and pulmonary embolism. Comparing trends in complication incidence, pulmonary events before and after sites switched to MPS2 closely mimic those observed with ‘all events’, illustrating pulmonary complication's prominent contribution to overall AE rate.
Research comparing outcomes with microplegia versus blood cardioplegia have been mixed. Published benefits of microplegia have included a reduction in edema postoperative cardiac low output syndrome, myocardial troponin-I and lactate release, diastolic function and transfusions [1,3,5,6].
Other cardioplegia parameters may impact the extent of myocardial protection, including perfusion temperature, pressure or method (antegrade, retrograde and continuous). Microplegia delivery systems offer precise control over cardioplegia temperature and delivery pressure. Despite an ongoing debate as to the optimal cardioplegia temperature, use of hypothermic cardioplegia is the predominant method employed, on the premise that decreased myocardial temperature provides lowered oxygen consumption [17]. Analysis could not identify perfusion temperature, pressure or method (antegrade, retrograde and continuous).
To our knowledge, this is the first study of economic and hospital parameters with the adoption of a microplegia delivery system. Regardless of the mechanism, adoption of the MPS2 system resulted in a decrease in hospital stay and overall cost. Long-term impact of the device is not captured.
Strengths & limitations
Strengths of this study include the use of a comprehensive data source (Premier Healthcare Database) and the strength of the methods. The DID methodology along with the fixed effect and the steps taken to control for unobservable factors, such as physician preferences, academic status and internal protocols (including but not limited to hydration protocols), in addition to observable factors allowed for a comprehensive evaluation of the consequence to institutions initiating use of the MPS2.
The limitations of this study are those that are inherent in retrospective database analyses. The unit of inference in our study was the visit and not the patient, thus repeated procedures in the same patient may have worked to influence the results. The data source for this study was the Premier Healthcare Database which represented 20% of all inpatient discharges in the USA; however, given its reliance on ICD-9 codes, the risk of coding errors or undercoding of nonbillable events cannot be eliminated. Another limitation of this data source is that it does not track patients longitudinally. Thus, it was not possible to determine if events occurred after a patient was discharged.
Conclusion
This study finds significant benefits associated with the introduction of the second generation microplegia delivery system, including a reduction in AEs, LOS and ICU days, as well as a reduction in overall and medication costs for CABG, AVR and MVR inpatient surgeries.
This study was conducted to determine the clinical and economic impact of a second generation microplegia delivery system (MPS2) compared with traditional cardioplegia (TC) from the hospital perspective.
This retrospective cohort study used records from the Premier Hospital Database from January 2009 to March 2015, for patients undergoing one of the following primary procedures: coronary artery bypass graft, aortic valve replacement or mitral valve replacement.
Outcomes for this analysis included: a composite adverse event (AE) end point, total visit cost, medication cost, length of stay (LOS) and intensive care unit (ICU) days. The composite AE included: major cardiac or renal events (acute kidney injury with and without dialysis, acute myocardial infarction, angina, stent occlusion/thrombosis, stroke and transient ischemic attack), sepsis or other infection, wound, abdominal or pulmonary complications, cardiogenic shock, bleeding or death.
A multivariable difference-in-differences analysis which used fixed effects was performed for each outcome. The hospital fixed-effect specification was chosen to control for time-invariant hospital characteristics that are otherwise unobservable, such as specific hospital protocols. The difference-in-difference allowed for the examination of the effect of hospitals’ usage of the MPS2 system by comparing patients undergoing cardiac surgeries using MPS2 with patients undergoing these surgeries in the same hospitals before the introduction of the MPS2 system, as well as to patients undergoing these surgeries in hospitals using TC. In hospitals that adapted the MPS2 system, procedures in the first 3 months after the switch were excluded. All models were adjusted for patient demographics, surgical characteristics and comorbid conditions. All costs were adjusted to 2015 dollars based on the consumer price index.
A total of 256,814 visits met the inclusion criteria. After controlling for within hospital variation and all covariates, there was a 2.25% absolute risk reduction in the composite of AEs with MPS2 compared with TC, which equates to a relative risk reduction of 5.25%.
There were significant reductions in LOS and ICU days at the 0.1 α level. An average of 9.75 hospital days with 2.94 ICU days for TC and 9.56 and 2.82 days, respectively for MPS2.
A per case reduction of US$1231 in total visit costs and a US$192 in medication costs was found in MPS2 hospitals. This equates to a 2.5% reduction in total cost and a 5% reduction in medication costs.
For hospitals performing coronary artery bypass graft, aortic valve replacement and mitral valve replacement surgeries with second generation microplegia delivery systems, significant reductions were seen in AEs, LOS and ICU days, which lead to reductions in total visit costs and medication costs.
Supplementary data
To view the supplementary data that accompany this paper please visit the journal website at: Supplementary Material
Acknowledgements
All authors contributed to the concept or design of the study, approved the manuscript and are accountable for the integrity of the study. MW Gerdisch contributed to the interpretation of the data and critical revision of the manuscript. S Robinson contributed to the data acquisition and critical revision of the manuscript. S Makepeace contributed to the drafting and critical revision of the manuscript. G David, M Ryan and C Gunnarsson contributed to the data analysis, interpretation and critical revision of the manuscript.
Financial & competing interests disclosure
This study was sponsored by Quest Medical, Inc. MW Gerdisch is a consultant to Cryolife, Atricure and Biomet Zimmer as well as a lecturer to Atricure and Biomet Zimmer. S Robinson is an employee of Premier Healthcare Solutions, Inc., which is a paid consultant to Quest Medical, Inc. S Makepeace, M Ryan and C Gunnarsson are employees of and G David is an academic affiliate of CTI Clinical Trial and Consulting Services, Inc., which is a paid consultant to Quest Medical, Inc. The authors have no other relevant affiliations or financial involvement with any organization or entity with a financial interest in or financial conflict with the subject matter or materials discussed in the manuscript apart from those disclosed.
No writing assistance was utilized in the production of this manuscript.
Ethical conduct of research
All data used to perform this analysis were de-identified and accessed in compliance with the Health Insurance Portability and Accountability Act. As a retrospective analysis of a de-identified database, the research was exempt from IRB review under 45 CFR 46.101(b)(4).
Supplementary Material
File (suppl_appendices.docx)
- Download
- 21.59 KB
References
Papers of special note have been highlighted as: • of interest
1.
Ferguson ZG, Yarborough DE, Jarvis BL, Sistino JJ. Evidence-based medicine and myocardial protection – where is the evidence? Perfusion 30(5), 415–422 (2015).
2.
Mccann UG, 2nd, Lutz CJ, Picone AL et al. Whole blood cardioplegia (minicardioplegia) reduces myocardial edema after ischemic injury and cardiopulmonary bypass. J. Extra Corpor. Technol. 38(1), 14–21 (2006).
3.
Algarni KD, Weisel RD, Caldarone CA, Maganti M, Tsang K, Yau TM. Microplegia during coronary artery bypass grafting was associated with less low cardiac output syndrome: a propensity-matched comparison. Ann. Thorac. Surg. 95(5), 1532–1538 (2013).
• Discusses the clinical benefits of microplegia.
4.
Gong B, Ji B, Sun Y, Wang G, Liu J, Zheng Z. Is microplegia really superior to standard blood cardioplegia? The results from a meta-analysis. Perfusion 30(5), 375–382 (2015).
• Discusses the clinical benefits of microplegia.
5.
Guru V, Omura J, Alghamdi AA, Weisel R, Fremes SE. Is blood superior to crystalloid cardioplegia? A meta-analysis of randomized clinical trials. Circulation 114(1 Suppl.), I331–I338 (2006).
6.
Onorati F, Santini F, Dandale R et al. “Polarizing” microplegia improves cardiac cycle efficiency after CABG for unstable angina. Int. J. Cardiol. 167(6), 2739–2746 (2013).
7.
Premier Healthcare Database: date that informs and preforms. https://learn.premierinc.com/pharmacy-and-research/premier-healthcare-database-whitepaper.
8.
Ernst FR, Chen E, Lipkin C, Tayama D, Amin AN. Comparison of hospital length of stay, costs, and readmissions of alteplase versus catheter replacement among patients with occluded central venous catheters. J. Hosp. Med. 9(8), 490–496 (2014).
9.
Ailawadi G, Zacour RK. Cardiopulmonary bypass/extracorporeal membrane oxygenation/left heart bypass: indications, techniques, and complications. Surg. Clin. North Am. 89(4), 781–796; vii–viii (2009).
10.
Quan H, Sundararajan V, Halfon P et al. Coding algorithms for defining comorbidities in ICD-9-CM and ICD-10 administrative data. Med. Care 43(11), 1130–1139 (2005).
11.
12.
Averill RF, Goldfield N, Hughes JS et al. All Patient Refined Diagnosis Related Groups (APR-DRGs). Methodology overview. Document number GRP–041. Version 20.0 (2003). https://www.hcup-us.ahrq.gov/db/nation/nis/APR-DRGsV20MethodologyOverviewandBibliography.pdf.
13.
Gravlee GP, Davis RF, Stammers AH, Ungerleider RM. Cardiopulmonary Bypass, Principles and Practice (3rd Edition). Lippincott Williams & Wilkins, a Wolters Kluwer Business. Philadelphia, PA, USA (2008).
• Discusses the clinical benefits of microplegia.
14.
Campbell JA, Holt DW, Shostrom VK, Durham SJ. Influence of intraoperative fluid volume on cardiopulmonary bypass hematocrit and blood transfusions in coronary artery bypass surgery. J. Extra Corpor. Technol. 40(2), 99–108 (2008).
15.
Ranucci M, Carboni G, Cotza M et al. Hemodilution on cardiopulmonary bypass as a determinant of early postoperative hyperlactatemia. PLoS ONE 10(5), e0126939 (2015).
16.
Karkouti K, Beattie WS, Wijeysundera DN et al. Hemodilution during cardiopulmonary bypass is an independent risk factor for acute renal failure in adult cardiac surgery. J. Thorac. Cardiovasc. Surg. 129(2), 391–400 (2005).
17.
Baikoussis NG, Papakonstantinou NA, Verra C et al. Mechanisms of oxidative stress and myocardial protection during open-heart surgery. Ann. Card. Anaesth. 18(4), 555–564 (2015).
Information & Authors
Information
Published In
Copyright
© 2018 Future Medicine Ltd.
History
Received: 8 February 2018
Accepted: 4 April 2018
Published online: 23 April 2018
Keywords:
Topics
Authors
Metrics & Citations
Metrics
Article Usage
Article usage data only available from February 2023. Historical article usage data, showing the number of article downloads, is available upon request.
Citations
How to Cite
Clinical and economic benefits of advanced microplegia delivery system in cardiac surgery: evidence from 250 hospitals. (2018) Journal of Comparative Effectiveness Research. DOI: 10.2217/cer-2018-0011
Export citation
Select the citation format you wish to export for this article or chapter.