Healthcare utilization and costs of multiple sclerosis patients in the Netherlands: a healthcare claims database study
Abstract
Aim: To investigate the incidence and prevalence and healthcare costs of multiple sclerosis (MS) in the Netherlands by using healthcare claims data. Materials & methods: A claims database was analyzed including 26% of the Dutch population. Results: Average prevalence of MS in the Netherlands was 88 per 100,000 inhabitants (males 48, 127 females) and incidence nine per 100,000. Yearly per patient medication costs were highest in the year after the first MS claim and then decreased. Hospital costs were 30% higher in the first year of MS claims than after 3 years of MS claims. The patients often used co-medication, such as antidepressants and antibiotics. Conclusion: Dutch incidence and cost estimates based on claims were consistent with previous estimates. Prevalence estimates were somewhat higher. Drug and hospital costs were highest shortly after the diagnosis. Healthcare consumption related to comorbidities was in-line with the previously reported comorbidity estimates.
Multiple sclerosis (MS) is a chronic disorder that can substantially impact patients’ quality of life. It is an autoinflammatory demyelinating disease which damages the CNS. The patients’ immune system attacks the myelin sheath around the nerves, potentially causing neurodegeneration. Damage to the myelin sheaths commonly results in lesions in the brain tissue of MS patients which can be identified through an MRI scan. How the disease manifests itself differs strongly between patients. Not only the MS symptoms and their severity, but also the progression of the disease differs. Often, vision problems are one of the first signs of MS caused by damage to the optic nerves. Later, patients often suffer from impaired mobility [1]. Moreover, they may face cognitive problems, fatigue and sexual disturbances. Symptoms of the disease can also disturb work ability and social relations [2]. The main factor influencing patients’ quality of life, however, may be the depressive symptoms that many patients experience [3]. Several subtypes of MS can be recognized, of which the relapsing-remitting type is the most prevalent [4].
The treatment of the disease and the related symptoms result in intensive use of the healthcare system. Based on information from patient questionnaires, annual per patient societal costs in Europe including medical costs and non-medical costs, such as productivity costs and informal care costs, were estimated to be between €18,000 and €62,000 depending on disease severity [5].
In a relatively recent review, prevalence estimates of MS range between 62 and 128 per 100,000 persons in central Europe [6]. However, Dutch specific prevalence numbers were not presented. In general, collecting reliable data to be able to estimate numbers such as incidence and prevalence of a disease, overall burden of disease or healthcare resource use is often very challenging. In some countries national databases are available, allowing to calculate these figures. Usually population-based numbers are estimated by extrapolating numbers from data of a subset of the population. Such datasets can consist of data collected in clinical trials, observational studies or from electronic medical files. Another option would be using health insurers’ claims data. Such claim datasets are often larger than study datasets, improving the generalizability of outcomes. However, claims data also involve challenges such as individuals switching from health insurer and changes in the set-up of such databases overtime.
This study aimed to: investigate the incidence and prevalence of MS in the Netherlands by using claims data; create insight in the healthcare use and related costs of MS patients; and provide insight in the suitability of using health insurers’ real world data for this purpose.
In order to meet these aims, a large healthcare claims database was analyzed including data of approximately 25% of the Dutch population.
Methods
Data source
Every resident of the Netherlands is compulsorily insured covering most important healthcare facilities, for example, primary care, hospital care and medication. Several health insurers are active in the Dutch market. The analyses presented in this paper are conducted on a healthcare claims database owned by Zilveren Kruis. This insurer is a major healthcare insurer active throughout the Netherlands. The database includes claims data of approximately a quarter of the Dutch adult population. Although the insurer has a relatively small market share in the south of the Netherlands, the 4.2 million insured people give a good representation of the healthcare use of residents of the Netherlands. All the claims are routinely recorded for the insured population in the Zilveren Kruis Health Database. Because of the financial importance of correctly paying the claims there is intensive automated monitoring. This causes the database to be accurate. Data are only provided anonymously for scientific research to third parties and in accordance with the Dutch privacy legislation. The database include background information on the insured and the healthcare providers and it contains the data of the claims for the treatments provided.
For this study, 9 years of claims data were available: from January 2006 until December 2014. The available data contain a variety of patient information such as an anonymized patient ID, gender and age. Moreover, it is registered whether the patient was alive at the end of each year, or what the date of death was. With regard to healthcare utilization, the database includes the dispensing of all outpatient drug prescriptions. With respect to hospital care, the database includes the diagnoses codes and the corresponding costs. Note that the diagnosis coding system changed as of 2012, causing potential data fluctuations.
Analysis
All analyses were performed using SAS® version 9.4 (SAS Institute, NC, USA). The analyses are performed on a variety of subsets of the insured/MS patients. A summary of the subsets is provided in Table 1.
| Analysis | Subset | Number of persons included | Follow-up period | Results presented in: |
|---|---|---|---|---|
| Estimating incidence | The patients without MS claim in previous 2 years | 4,357,185 (in 2014) | 2008–2014 | Table 3 |
| Estimating prevalence | The patients with an MS claim in the concerning year | 4,357,185 (in 2014) | 2006–2014 | Table 3 |
| Estimating hospital and medication costs of ‘average’ MS patient | The patients with MS claim in 2006 & still in database at end of follow-up period | 1523 | 2006–2014 | Table 4 |
| Estimating hospital and medication costs of newly diagnosed patient | The patients without MS claim in previous 2 and 4 year follow-up available | 1037 | 2008–2014 (4 year follow-up per patient) | Table 5 |
| Determining most used co-medication and non-MS specific hospital care | The patients with at least one MS-specific claim between 2012 and 2014 | 3725 | 2012–2014 | Tables 6 and 7 |
MS: Multiple sclerosis.
Incidence & prevalence
The incidence of MS in the Netherlands was estimated by exploring the number of ‘first-time’ claims in the database. In order to be labeled as a new patient, patients should not have an MS related claim in the previous 2 years (based on drug prescription or diagnose code; e.g., claims with the code 9920 and 0531 are MS related claims). Consequently, yearly incidence estimates were available of new patients for the period of 2008–2014.
Prevalence of MS was estimated based on the number of individuals who had at least one MS claim within the year of concern. In other words, the patients who did not receive any MS care in the given year have not been included in the estimates.
Resource use & costs
The resource use estimates based on the claims database include the costs of retail prescriptions and the costs of hospital claims.
Medication claims
The medication claims in the database include all drug prescriptions dispensed in the retail channel. Note that the use of privately payed disposables or payments for over-the-counter medications is not available. A distinction is made between specific MS drugs and non-MS prescriptions. There were no data available of drug use during hospital stays. The following drugs indicated for MS were included in the analysis as MS-specific drugs: interferons, glatiramer acetate, natalizumab, fingolimod. These comprise the major part of MS drugs prescribed in the Netherlands. The interferons and glatiramer acetate can be prescribed for clinically isolated syndrome and relapsing remitting multiple sclerosis (RRMS) and are reimbursed for these indications. Although natalizumab and fingolimod can be prescribed for highly active RRMS patients only. The latter products are prescribed when interferon or glatiramer acetate treatment is inadequate for disease control or when the patient does not sufficiently tolerate them. Mitoxantrone, rituximab and cyclophosphamide could be used for a very small negligible part of the MS population in the Netherlands. These drugs are not included as MS-specific drug costs.
Hospital claims
Hospital claims are classified into diagnose related group (DRG; in Dutch: diagnose-behandelcombinatie) and include all care that takes place in the hospital, such as admissions, operations, day admissions and visits to the polyclinic. In the analyses, a distinction is made between MS-specific claims and non-MS-specific claims. MS-specific claims include claims labeled with a specific MS DRG code.
Costs
All cost estimates are based on the costs reported in the database. In other words, these are the costs that are paid by the health insurer directly to the provider or to the patient and costs were not converted to a base year. Patients’ average healthcare costs between 2006 and 2014 were calculated and reported. Healthcare costs for existing and newly diagnosed patients were calculated separately. First, only patients were included that already had an MS-related claim in 2006 (i.e., we excluded new MS patients after 2006 and newly insured persons with MS) and this cohort was followed through the years. For these analyses, only patients were included if insured by Zilveren Kruis for the full observational period and still alive at the end of that period. For example, data are not included from patients who left the insurer before the end of the observation period. The patients with an MS-related claim in 2006 were followed in the subsequent years regardless of whether they had MS-related claims after 2006. These cohort analyses were conducted to give insight in the resource utilization and costs of the ‘average’ MS patient after the initial diagnosing phase.
To calculate the healthcare costs of newly diagnosed patients, the patients labeled as new patients between 2008 and 2011 were included in the analysis. To be labeled as a new patient, the patients should not have any MS claim in the preceding 2 years. After the first claim, all the patients were followed for 4 years exactly: year 0 (the year of first claim and assumed diagnosis + three subsequent years). The patients were only included if insured at Zilveren Kruis for the total observation period (2 years prior to the first MS claim and 4 years after).
Comorbidity
To obtain insight in the MS patients’ comorbidity, it was analyzed what types of non-MS-specific medication patients used and what sort of non-MS-specific hospital resource use was claimed. Given the new coding system started in 2012, the non-MS-specific hospital claims analyses were limited to the data of 2012 until 2014 in order to have a consistent coding of DRGs. In these analyses, only patients were included with at least one MS-related claim (MS DRG code or MS drug) between 2012 and 2014 and who were still alive at the end of 2014. The non-MS-specific hospital claims were clustered into coherent groups. For instance, all DRGs related to eye care were combined in one group.
Retail drugs were similarly clustered into groups. For instance, decongestants and other nasal preparations for topical use, antihistamines for systemic use and cough and cold preparations were grouped as ‘hay fever, allergy and cough drugs’. Next, the clustered drug groups were ordered from most frequent to least in terms of patient counts. The groups of non-MS related claims are reported when including 5% or more of the patients. Note that, although the patients’ non-MS-specific drug use gives insight in the amount of additional health problems, the precise underlying condition often cannot be specified, since some of the prescription drugs can be administered for multiple indications.
Results
In 2014, the Zilveren Kruis claims database included data of 4,357,185 people, which is approximately 26% of the Dutch population in 2014. The average age of the insured persons was 41 and 49.5% were males. The average age of the MS patients in the database in 2014 was 44 (Table 2), of which 73.6 were females. In 2014, there were 2416 patients with an MS-specific drug or hospital claim. The total MS and non-MS-specific medication and hospital costs of these patients added up to almost €11 million.
| Characteristics (2014 population) | MS patients (n = 2416) |
|---|---|
| Average age (median) | 44.4 (44) |
| Sex (% female) | 73.6 |
| Total number of claims (MS and non-MS specific) in 2014: | 314,439 |
| • Total medication claims | 183,342 |
| • Number of hospital claims | 131,097 |
| Total healthcare costs (medication + hospital) | €10,930,593 |
MS: Multiple sclerosis.
Prevalence
On average over the 9 years, 88 persons per 100,000 insured persons had an MS-specific healthcare claim (Table 3). The prevalence estimate based on the number of persons with an MS-specific claim was 48 per 100,000 for males and 127 per 100,000 for females. The average age of the MS patients in the database was 46.5.
| 2006 | 2007 | 2008 | 2009 | 2010 | 2011 | 2012 | 2013 | 2014 | Average | |
|---|---|---|---|---|---|---|---|---|---|---|
| Prevalence | ||||||||||
| Total MS patients: | 2194 | 2446 | 2524 | 2925 | 2962 | 3011 | 3198 | 4421 | 2416 | 2900 |
| – Male | 601 | 665 | 662 | 799 | 817 | 817 | 878 | 1184 | 638 | 785 |
| – Female | 1593 | 1781 | 1862 | 2126 | 2145 | 2194 | 2320 | 3237 | 1778 | 2115 |
| Average age patients | 46.4 | 46.3 | 46.8 | 46.6 | 46.8 | 47.1 | 46.8 | 47.1 | 44.4 | 46.5 |
| Median age patients | 46 | 46 | 47 | 47 | 47 | 47 | 47 | 47 | 44 | 46 |
| Patients per 100,000 insured persons: | 80 | 87 | 90 | 91 | 93 | 96 | 99 | 98 | 55 | 88 |
| – Male | 44 | 48 | 47 | 50 | 51 | 52 | 54 | 53 | 30 | 48 |
| – Female | 114 | 126 | 132 | 132 | 135 | 140 | 144 | 142 | 81 | 127 |
| Incidence | ||||||||||
| New MS patients: | – | – | 432 | 345 | 292 | 266 | 312 | 298 | 214 | 308 |
| – Male | – | - | 117 | 98 | 73 | 88 | 107 | 87 | 53 | 89 |
| – Female | – | – | 315 | 247 | 219 | 178 | 205 | 211 | 161 | 219 |
| New patients per 100,000 insured persons: | – | – | 15 | 11 | 9 | 8 | 10 | 7 | 5 | 9 |
| – Male | – | – | 8 | 6 | 5 | 6 | 7 | 4 | 2 | 5 |
| – Female | – | – | 22 | 15 | 14 | 11 | 13 | 9 | 7 | 13 |
| Age new patients | – | – | 44.4 | 42.7 | 41.5 | 43.6 | 41.9 | 41.7 | 41.1 | 42.4 |
| Median age new patients | – | – | 44 | 42 | 40.5 | 43 | 42 | 41 | 39 | 42 |
MS: Multiple sclerosis.
Incidence
On an average, the number of new MS patients (as defined by not having an MS-specific claim in the previous 2 years) in the database between 2008 and 2014 was nine per 100,000. The average age of the new patients between 2008 and 2014 was 42.4 and the median age of new MS patients was 42.
Resource use
Table 4 expresses the average healthcare costs of the patients who had an MS claim in 2006 and remained alive and insured at Zilveren Kruis for the entire observation period. Newly insured people and new MS patients after 2006 were not included. As illustrated in Table 4, the medication costs of the patient group steadily decreased overtime. This decrease seems mainly caused by a decrease in MS-specific costs, in other words, the patients seem to use less MS-specific drugs over time. The hospital costs seem relatively stable. The sudden excessive costs in 2012 and 2013 cannot be explained, but may be related to a change in DRG coding. The non-MS-specific claims seem to increase over time and the MS-specific claims seem to decrease (with the exception of 2012 and 2013).
| 2006 | 2007 | 2008 | 2009 | 2010 | 2011 | 2012 | 2013 | 2014 | |
|---|---|---|---|---|---|---|---|---|---|
| Total medication costs (€) | 5542 | 5847 | 5559 | 5265 | 5132 | 4390 | 4313 | 4338 | 3764 |
| Percentage of total hospital + medical costs (€): | 62% | 68% | 68% | 62% | 63% | 58% | 36% | 38% | 52% |
| – Non-MS drugs | 550 | 600 | 627 | 656 | 745 | 855 | 865 | 833 | 744 |
| – MS drugs | 4991 | 5247 | 4931 | 4609 | 4387 | 3534 | 3448 | 3505 | 3020 |
| Total hospital costs (€) | 3469 | 2748 | 2669 | 3217 | 3069 | 3174 | 7520 | 7205 | 3413 |
| Percentage of total hospital + medical costs (€) | 38% | 32% | 32% | 38% | 37% | 42% | 64% | 62% | 48% |
| – Non-MS-specific claims | 1597 | 1655 | 1621 | 2200 | 2056 | 2180 | 6721 | 6513 | 3311 |
| – MS-specific hospital claims | 1872 | 1094 | 1047 | 1017 | 1013 | 994 | 799 | 692 | 101 |
| Total medication + hospital costs per patient (€) | 9011 | 8595 | 8227 | 8482 | 8201 | 7563 | 11833 | 11543 | 7177 |
MS: Multiple sclerosis.
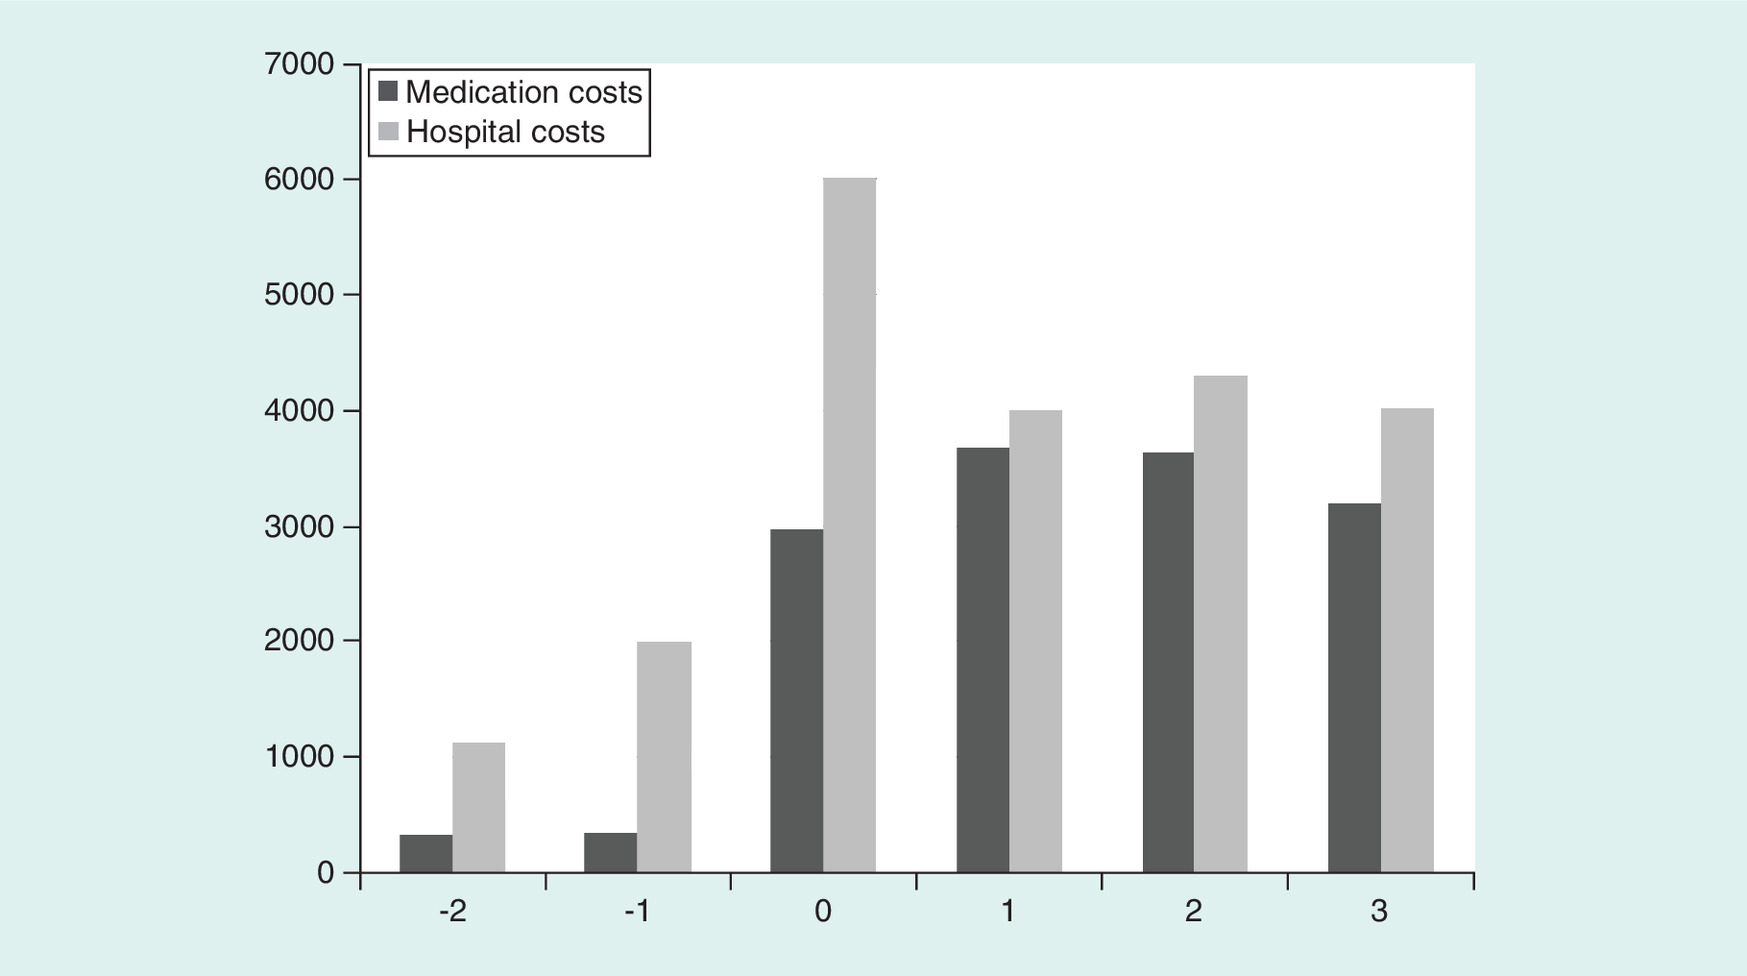
As reported in Table 5 and illustrated in Figure 1, the average medication costs and hospital costs in the year of the first MS claim (year 0) were substantially higher than in the 2 years before the first MS claim. Medication costs increased a bit further in the year after diagnosis and then slowly decreased in the years after. MS-specific hospital costs were considerably higher in the year of the first MS claim than in subsequent years. Hospital costs stayed stable from the year after diagnosis and onward.
| Year | Number of patients with claims† | Percentage of patients versus year of first MS claim | Costs per patient, € (SD) | Percentage of costs versus year of first MS claim | |
|---|---|---|---|---|---|
| Medication claims‡ | -2 | 887 | 86% | 331 (33.2) | 11% |
| -1 | 902 | 87% | 343 (35.0) | 12% | |
| 0 | 951 | 92% | 2965 (177) | 100% | |
| 1 | 945 | 91% | 3684 (207.7) | 124% | |
| 2 | 931 | 90% | 3635 (193) | 123% | |
| 3 | 899 | 87% | 3194 (179.6) | 108% | |
| Hospital claims§ | -2 | 746 | 72% | 1131 (97.1) | 19% |
| -1 | 890 | 86% | 1997 (190.2) | 33% | |
| 0 | 1036 | 99.9% | 6008 (428) | 100% | |
| 1 | 939 | 91% | 4008 (377.9) | 67% | |
| 2 | 905 | 87% | 4304 (381.1) | 72% | |
| 3 | 793 | 76% | 4025 (420.3) | 67% |
†The total number of new patients included in the analyses with either a first MS drug or an MS-specific hospital claim in year 0 is 1037.
‡Only includes patients with medication claims.
§Only includes patients with hospital claims.
MS: Multiple sclerosis; SD: Standard deviation.
Comorbidity
Table 6 presents the non-MS-specific medication use of MS patients with at least one MS-specific claim in a 3-year time period (2012–2014). As illustrated, most patients used at least one non-MS-specific drug. Over half of the patients used antibiotics and a large group of patients used one or more types of pain medication. Over a quarter of patients used antidepressants in the 3-year time period, 22% used antiepileptic drugs and 13% used asthma medication.
| Label | Patients (n = 3725) | Percentage patients | Number of claims 2012–2014 | Costs 2012–2014 |
|---|---|---|---|---|
| Any co-medication | 3241 | 87% | 45,056 | 21,109,087 |
| Oral antibiotics | 2306 | 62% | 10,553 | 159,799 |
| Prescription creams | 1659 | 45% | 5669 | 80,516 |
| NSAIDs | 1644 | 44% | 5516 | 80,400 |
| Hay fever, allergy and cough drugs | 1350 | 36% | 5649 | 85,564 |
| Laxatives | 1193 | 32% | 5776 | 141,903 |
| Drugs for hypertension, CVD and cholesterol | 1082 | 29% | 16,773 | 277,483 |
| Ophthalmological drugs | 1026 | 28% | 4453 | 81,777 |
| Antidepressants | 1018 | 27% | 9724 | 133,059 |
| Analgesics | 960 | 26% | 6563 | 201,472 |
| Antacids | 894 | 24% | 6335 | 76,521 |
| Antiepileptic medication | 800 | 22% | 8028 | 440,430 |
| Anticonceptives (including IUD) | 751 | 20% | 2703 | 57,717 |
| Muscle relaxants | 622 | 17% | 7093 | 149,343 |
| Oral corticosteroids | 581 | 16% | 1538 | 30,945 |
| Vitamin D supplements | 574 | 15% | 1860 | 35,975 |
| Anticoagulants | 533 | 14% | 4117 | 76,838 |
| Asthma medication | 480 | 13% | 3411 | 200,121 |
| Antipsychotics and tranquilizers | 464 | 12% | 5253 | 83,645 |
| Antifungal creams | 419 | 11% | 973 | 13,835 |
| Parkinson medication | 404 | 11% | 2723 | 89,206 |
| Calcium supplements | 392 | 11% | 2544 | 63,107 |
| Vaginal antifungal medication | 353 | 9% | 710 | 10,996 |
| B12 and folic acid supplements | 309 | 8% | 1388 | 13,372 |
| Drugs for functional gastrointestinal disorders | 307 | 8% | 788 | 13,322 |
| Oral antifungal medication | 213 | 6% | 430 | 36,045 |
CVD: Cardiovascular disease; IUD: Intrauterine device; NSAID: Non-steroidal anti-inflammatory drug.
All non-MS-specific hospital claims that occurred relatively frequently in the database could be grouped in three care types: eye care, physical rehabilitation and urogenital care. Eye care, for example, includes (among others) polyclinic visits for eye and eye nerve conditions and visits related to eye infections. As reported in Table 7, more than a quarter of these patients had claims for physical rehabilitation and eye care in the 3-year period and 25% had a claim for urogenital care.
| Hospital claims label | Patients (n = 3725) | Percentage of patients | Number of claims 2012–2014 | Costs (€) 2012–2014 |
|---|---|---|---|---|
| Physical rehabilitation | 1081 | 29 | 3812 | 3,002,104 |
| Eye care | 1022 | 27 | 4135 | 2,310,140 |
| Urogenital care | 927 | 25 | 2720 | 631,059 |
Discussion
This study aimed to explore the incidence and prevalence of MS in the Netherlands by means of a large claims database. The MS prevalence for the Netherlands based on the analyzed healthcare claims data were 88 persons per 100,000. This is in line with previously reported prevalence numbers. For example in a review by Kingswell et al. [6], the reported prevalence for central Europe varied between 62 and 127 per 100,000 and in a study in the northern province of the Netherlands the prevalence was estimated to be 76 per 100,000 [7]. The incidence based on the claims analysis was nine per 100,000. This incidence rate is higher than the average European incidence rate of 4.3/100,000 and the mean total incidence rate of 3.0 for the northern province in the Netherlands for the period of 1985–1990 reported by Minderhoud et al. [7]. The average age of the new patients in the dataset was 42.4 and the median age was 42. This is higher than the average self-reported age of 39.9 at diagnose of a group of 382 MS patients in the Netherlands in the recent study of Uitdehaag et al. [8]. Average self-reported age of Dutch patients at diagnosis in a study by Karampampa et al. (n = 263) was 35 in the subgroup with a low EDSS score from 0 to 3, 39 in the subgroup with a score between 4 and 6.5 and 35 in the subgroup with score from 7 to 9 [9].
Next to incidence and prevalence, this study aimed to create insight in the real-world healthcare use and related costs of the MS patients. Yearly per patient medication costs were highest in the year after the first MS claim and then steadily decreased. Hospital costs were substantially higher in the year of the first MS claims than in subsequent years. Hospital costs stayed stable from the year after diagnosis and onward. The hospital peak costs in the year of diagnosis may to an extent be related to the costs of diagnostic tests and initiating treatment. With regard to co-morbidities, the results indicated that the majority of patients used at least one type of non-MS-specific medication during a 3-year observation period. A high share of patients used (among other things) antibiotics (62%), pain medication (26%), antidepressants (27%) and asthma medication (13%). This drug use is in line with outcomes of previous studies reporting on the incidence and prevalence of comorbidities in MS (although not Dutch-specific). For instance, meta-analyses conducted in the study of Marrie et al. resulted in a prevalence estimate of depression among MS patients of 24% and a prevalence of chronic lung disorders of 10% [10]. Moreover, in our dataset in a 3-year period, more than a quarter of patients had claims for physical rehabilitation and eye care and 25% had a claim for urogenital care. The amount of patients receiving eye care is comparable to the findings of Jasse et al. reporting that about a third of the MS patients have persistent visual impairment [11]. Moreover, it was estimated previously that about two-third of the MS patients may suffer from moderate to severe MS-related urinary disturbances [12].
There are some important limitations to this study that need noting. A clear limitation of claims database analysis, is that the available information is limited to the claims the health insurer received. Although the claims give an indication of the health problems MS patients’ face, clinical information is not available. Moreover, since the hospital is DRG based, it was not possible to specify costs very detailed and information such as number of hospital admissions is lacking.
A key limitation of the presented incidence and prevalence estimates is that MS patients that do not receive any specific MS medication or hospital care are not identified as MS patients. This implies that prevalence numbers are likely to be an underestimation. Moreover, to calculate incidence, we assumed that patients that did not have an MS-specific medication or hospital claim in the previous 2 years. However, it may be that some previously diagnosed patients went without MS-specific care for longer periods. This idea is strengthened by the relatively high average age of identified new MS patients. If this indeed is the case, incidence may be overestimated and prevalence underestimated. Consequently, some caution is needed with applying the incidence and prevalence numbers presented in this paper.
Additionally, an important limitation is that the DRG coding in the Netherlands changed in 2012. This implies that the reported hospital resource use before and after 1 January 2012 is not directly comparable. Moreover, the number of patients differed quite a bit between years and the number of enrollees of the health insurer strongly differed in 2014. Also, the incidence and prevalence in 2014 seemed to deviate from the previous years. We cannot explain these differences observed in 2014. Moreover, we observed a very high unexplainable peak in non-MS-specific hospital costs in the years 2012 and 2013.
Furthermore, with regard to the healthcare resource use and costs of MS patients, the claims data that were available for this study only included hospital claims and medication claims. Other outpatient healthcare resource use, such as general practitioner consultations and physical therapy is not included. Besides, the patients may have substantial out-of-pocket expenditures, such as costs for over-the-counter medication, incontinence materials and walking and vision aids. Consequently, resource use and costs reported, are only a subset of total healthcare consumption costs of MS patients in the Netherlands. To illustrate, If our results are generalizable for the Dutch population, total MS-specific drug and hospital costs for 2014 would approximately be €42 million, whereas the total cost of care of MS patients in the Netherlands reimbursed by the health insurers was €136.6 million in 2011 [13].
Despite these limitations, this study has methodological strengths. Given the large size of the claims data that was analyzed, the outcomes provide a broad and unique insight in hospital resource use and medication costs of MS patients in the Netherlands. Moreover, claims data may give more accurate information compared with self-reported resource use reported in previous studies. The MS patients’ substantial healthcare resource use, contributes to patients’ health and well-being. MS care has improved over the last 20 years increasing patient’s overall quality of life resulting in less productivity loss and a decrease of constraints on informal care givers [14].
Conclusion
This paper provides unique Dutch incidence and prevalence estimates based on a large healthcare claims database. Incidence estimates are in line with previous estimates based on substantially smaller samples, although the prevalence estimates in this study are somewhat higher than in former studies. Patients’ resource use and related costs increased after an MS diagnosis; peak costs are seen in the year of diagnosis and the year after. Subsequently, MS-specific hospital and medication costs steadily decrease. The MS patients in the database consumed a considerable amount of non-MS-specific hospital care (i.e., care not involving a specific-MS DRG code) and were prescribed a substantial amount of non-MS-specific medication. The type of care consumed indicates that many MS patients suffer (among other things) from pain, mood disorders, infections, vision and mobility problems that could be associated to their MS diagnosis.
Multiple sclerosis (MS) is a chronic disorder that can substantially impact patients’ general health and quality of life.
This study aimed to investigate the incidence and prevalence of MS in the Netherlands by using claims data and to create insight in the healthcare use and related costs of MS patients.
For this study, 9 years of claims data were available containing a variety of patient information such as an anonymized patient ID, gender and age.
On average over the 9 years, the prevalence estimate based on the number of persons with an MS-specific claim was 88 persons per 100,000 insured; 48 for males and 127 for females.
Estimated incidence based on the claims data was nine per 100,000 and the average age of the new patients between 2008 and 2014 was 42.4 and median age was 42.
Yearly per-patient medication costs were highest in the year after the first MS claim and then decreased about 15% in the 2 years after.
Mean hospital costs were 30% higher in the year of the first MS claims than in the 3 years after. Drug and hospitalization costs remained higher than before the first MS claim.
The patients often used additional non-MS-specific care, such as eye care at the polyclinic. In 3 years, more than a quarter of patients used antidepressants and over half of them used antibiotics.
Incidence estimates are in line with the previous estimates based on substantially smaller samples, although the prevalence estimates in this study are somewhat higher than in former studies.
Acknowledgements
The authors would like to thank C Pescott and K Schiffers for their useful contributions throughout different phases of this study and the authors would like to thank F Pennekamp for his assistance in data processing.
Financial & competing interests disclosure
Merck BV, the Netherlands provided funding to HealthCare Insights for data acquisition and analysis. M Krol is a former employee and G de Voer is employee of Merck BV, Schiphol-Rijk, the Netherlands, an affiliate of Merck KGaA, Darmstadt, Germany. The authors have no other relevant affiliations or financial involvement with any organization or entity with a financial interest in or financial conflict with the subject matter or materials discussed in the manuscript apart from those disclosed.
No writing assistance was utilized in the productionof this manuscript.
Ethical conduct of research
This noninterventional study analyzing anonymous data did not include people, medical records, or human tissue, therefore, this study does not fall into the scope of the Dutch Medical Research Involving Human Subjects Act (Wet medisch-wetenschappelijk onderzoek met mensen: WMO). Ethical approval was consequently not required in the Netherlands. The anonymization and use of the data was conducted in compliance with Dutch data privacy law (Wet bescherming persoonsgegevens: Wbp).
Open access
This work is licensed under the Attribution-NonCommercial-NoDerivatives 4.0 Unported License. To view a copy of this license, visit http://creativecommons.org/licenses/by-nc-nd/4.0/
References
Papers of special note have been highlighted as: • of interest; •• of considerable interest
1.
Smrtka J, Brown T, Bjorklund G. Loss of mobility and the patient burden of multiple sclerosis: expert opinion on relevance to daily clinical practice. Postgrad. Med. 128(1), 145–151 (2016).
2.
Lysandropoulos AP, Havrdova E; ParadigMS Group. ‘Hidden’ factors influencing quality of life in patients with multiple sclerosis. Eur. J. Neurol. 22(Suppl. 2), 28–33 (2015).
3.
Lobentanz IS, Asenbaum S, Vass K et al. Factors influencing quality of life in multiple sclerosis patients: disability, depressive mood, fatigue and sleep quality. Acta Neurol. Scand. 110(1), 6–13 (2004).
4.
Butler M, Forte ML, Schwehr N, Carpenter A, Kane RL. Decisional dilemmas in discontinuing prolonged disease-modifying treatment for multiple sclerosis. Comparative Effectiveness Review No. 150, Report No. 15-EHC012-EF (2015).
5.
Kobelt G, Berg J, Lindgren P, Fredrikson S, Jönsson B. Costs and quality of life of patients with multiple sclerosis in Europe. J. Neurol. Neurosurg. Psych. 77(8), 918–926 (2006).
•• Provides a good overview of multiple sclerosis (MS) patients in Europe.
6.
Kingwell E, Marriott JJ, Jetté N et al. Incidence and prevalence of multiple sclerosis in Europe: a systematic review. BMC Neurol. 13, 128 (2013).
•• Provides a nice overview of available incidence and prevalent data in Europe.
7.
Minderhoud JM, Zwanniken CF. Increasing prevalence and incidence of multiple sclerosis: an epidemiological study in the province of Groningen, The Netherlands. In: Multiple Sclerosis in Europe: An Epidemiological Update. Firnhaber W, Lauer K (Eds). Leuchtturm – Verlag/LTV Press, Darmstadt, Germany, 113–121 (1994).
8.
Uitdehaag B, Kobelt G, Berg J, Capsa D, Dalén J. New insights into the burden and costs of multiple sclerosis in Europe: results for the Netherlands. Mult. Scler. 23(2 Suppl.), 117–129 (2017).
• Provides an overview of the Dutch results of a study investigating European burden and costs related to MS.
9.
Karampampa K, Gustavsson A, van Munster ET et al. Treatment experience, burden, and unmet needs (TRIBUNE) in multiple sclerosis study: the costs and utilities of MS patients in The Netherlands. J. Med. Econ. 16(7), 939–950 (2013).
10.
Marrie RA, Cohen J, Stuve O et al. A systematic review of the incidence and prevalence of comorbidity in multiple sclerosis: overview. Mult. Scler. 21(3), 263–281 (2015).
• Provides a nice overview of comorbidities of MS patients.
11.
Jasse L, Vukusic S, Durand-Dubief F et al. Persistent visual impairment in multiple sclerosis: prevalence, mechanisms and resulting disability. Mult. Scler. J. 19, 1618–1626 (2013).
12.
Aharony SM, Lam O, Corcos J. Evaluation of lower urinary tract symptoms in multiple sclerosis patients: review of the literature and current guidelines. Can. Urol. Assoc. J. 11(1–2), 61–64 (2017).
13.
Kosten van ziekten (2017). https://kostenvanziektentool.volksgezondheidenzorg.info/tool/nederlands/
14.
Pomp M. Arbeidsbaten en uitgespaarde zorgkostendoor innovatieve geneesmiddelen: Zes casestudies. www.vereniginginnovatievegeneesmiddelen.nl/stream/eindrapport-marc-pomp-pdf
Information & Authors
Information
Published In
Copyright
© 2018 Quintiles IMS.
History
Received: 27 September 2017
Accepted: 9 January 2018
Published online: 18 May 2018
Keywords:
Topics
Authors
Metrics & Citations
Metrics
Article Usage
Article usage data only available from February 2023. Historical article usage data, showing the number of article downloads, is available upon request.
Citations
How to Cite
Healthcare utilization and costs of multiple sclerosis patients in the Netherlands: a healthcare claims database study. (2018) Journal of Comparative Effectiveness Research. DOI: 10.2217/cer-2017-0077
Export citation
Select the citation format you wish to export for this article or chapter.
Citing Literature
- Ann M. Decker, Sandra H. Stuhr, Gustavo Avila‐Ortiz, Andrea Pilloni, Lorenzo Marini, Rogerio Castilho, Beth I. Wallace, Yvonne L. Hernandez‐Kapila, Oral wound healing in the elderly: Mechanisms, challenges, and innovations, Periodontology 2000, 10.1111/prd.70027, (2026).
- Cynthia. M.C. Lemmens, Joost W. Vanhommerig, Bart J. Knottnerus, Bernard M.J. Uitdehaag, Jop P. Mostert, Brigit A. de Jong, Prevalence and incidence of multiple sclerosis in the Netherlands, Multiple Sclerosis and Related Disorders, 10.1016/j.msard.2024.106207, 93, (106207), (2025).
- Pauline Ducatel, Marc Debouverie, Marc Soudant, Francis Guillemin, Guillaume Mathey, Jonathan Epstein, Performance of administrative databases for identifying individuals with multiple sclerosis, Scientific Reports, 10.1038/s41598-023-45384-w, 13, 1, (2023).
- Dirk Schriefer, Rocco Haase, Nils-Henning Ness, Tjalf Ziemssen, Cost of illness in multiple sclerosis by disease characteristics – A review of reviews, Expert Review of Pharmacoeconomics & Outcomes Research, 10.1080/14737167.2022.1987218, 22, 2, (177-195), (2021).
- Chantelle Murley, Petter Tinghög, Kristina Alexanderson, Jan Hillert, Emilie Friberg, Korinna Karampampa, Cost-of-Illness Progression Before and After Diagnosis of Multiple Sclerosis: A Nationwide Register-Based Cohort Study in Sweden of People Newly Diagnosed with Multiple Sclerosis and a Population-Based Matched Reference Group, PharmacoEconomics, 10.1007/s40273-021-01035-4, 39, 7, (835-851), (2021).
- Maria Paz-Zulueta, Paula Parás-Bravo, David Cantarero-Prieto, Carla Blázquez-Fernández, Agustín Oterino-Durán, A literature review of cost-of-illness studies on the economic burden of multiple sclerosis., Multiple Sclerosis and Related Disorders, 10.1016/j.msard.2020.102162, 43, (102162), (2020).
- Pia M. Vidal, Rodrigo Pacheco, Targeting the Dopaminergic System in Autoimmunity, Journal of Neuroimmune Pharmacology, 10.1007/s11481-019-09834-5, 15, 1, (57-73), (2019).