Burden of illness and research investments in translational sciences for pharmaceuticals in metastatic cancers
Abstract
Aim: To explore whether investments in translational sciences for six metastatic cancers follow idiosyncratic returns to those investments rather than levels of burden of illness (BI). Methods: Associate the number of translational clinical trials in the USA involving oncolytic drugs approved during 2008–2013 and the level (in 2008) and changes (2002–2008 and 2008–2014) in cancer-specific years of life lost. Results: Investments in trials were positively associated only with contemporary changes in BI (2008–2014). The relationship was stronger for government-sponsored comparative-effectiveness trials than for industry. Conclusion: Translational research investments follow anticipated changes to BI levels. Systematic quantification of these expected returns from specific investments can help guide investment decisions in translational health sciences and generate productive dialogue across stakeholders.

Figure 1. Relationship between cancer-specific total number of trials initiated through 2013 using oncology drugs approved during 2008–2013 and cancer-specific: (left) difference in years of life lost in 2008 versus 2002; (middle) absolute years of life lost in 2008; and (right) difference in years of life lost in 2014 versus 2008.
NSCLC: Non-small-cell lung cancer; YLL: Years of life lost.
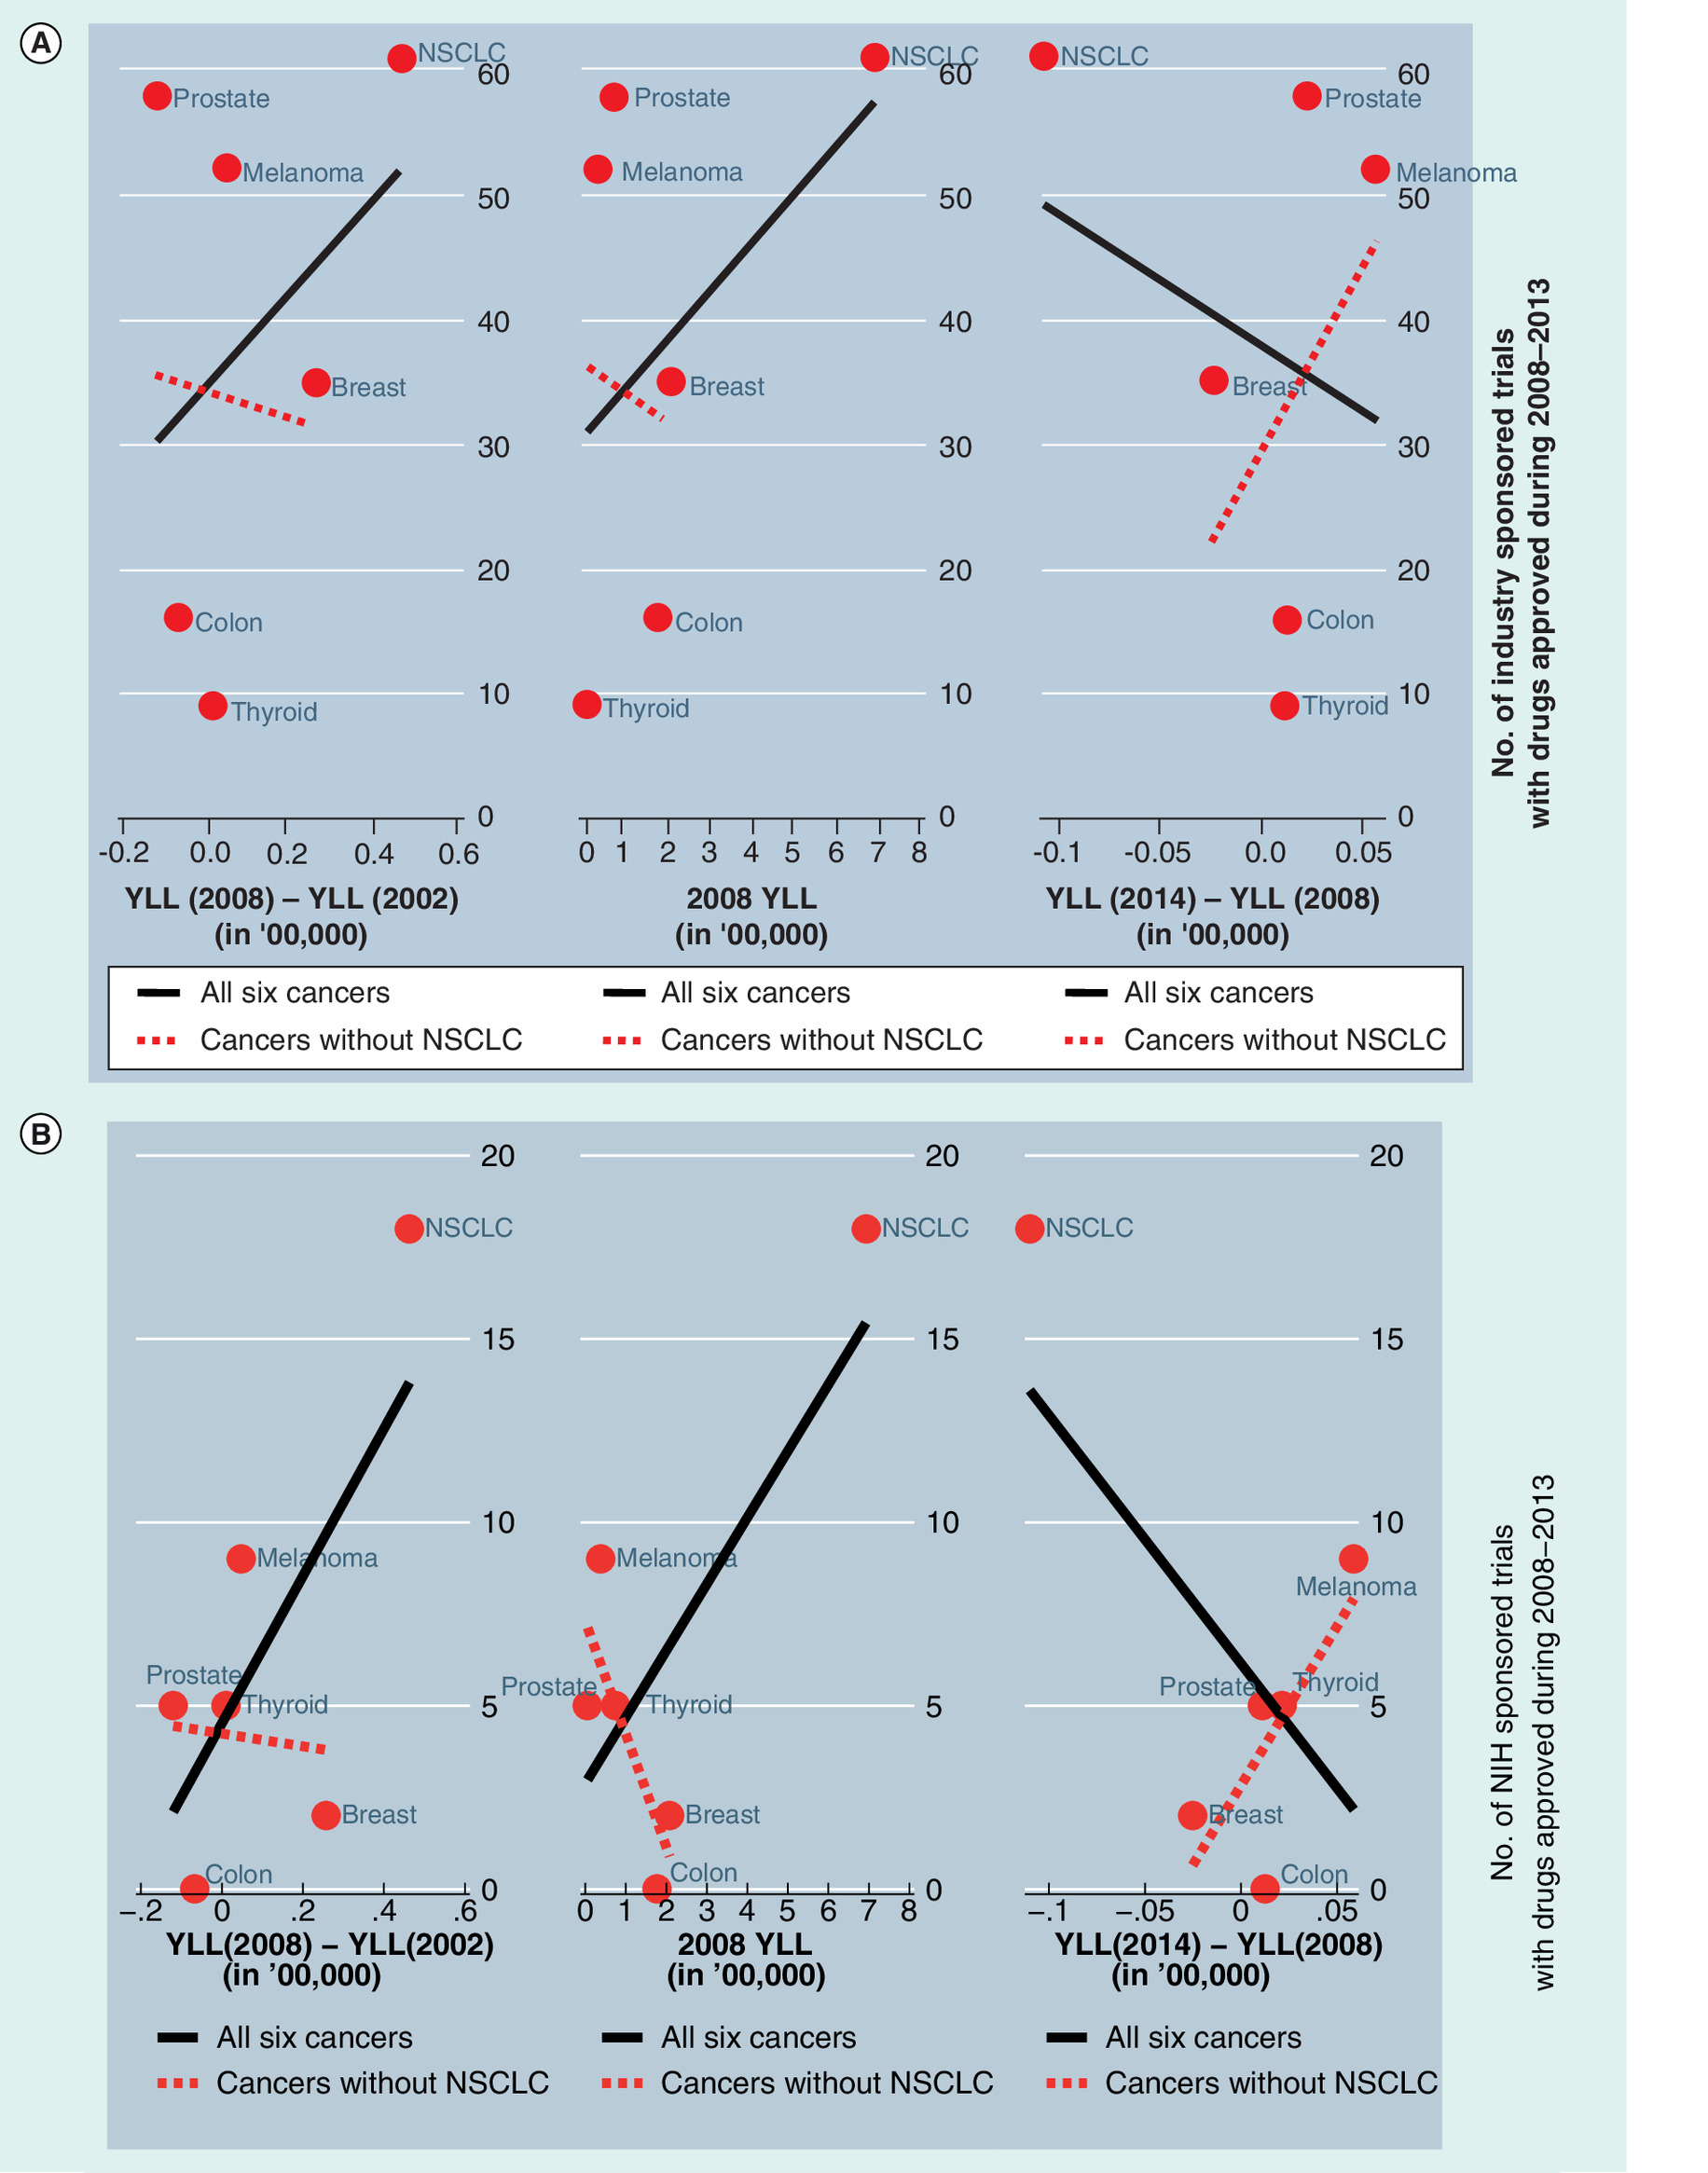
Figure 2. Relationship between cancer-specific total number of (A) industry-sponsored trials or (B) NIH-sponsored trials, initiated through 2013 using oncology drugs approved during 2008–2013 and cancer-specific (left) difference in years of life lost in 2008 versus 2002; (middle) absolute years of life lost in 2008; and (right) difference in years of life lost in 2014 versus 2008.
NSCLC: Non-small-cell lung cancer; YLL: Years of life lost.
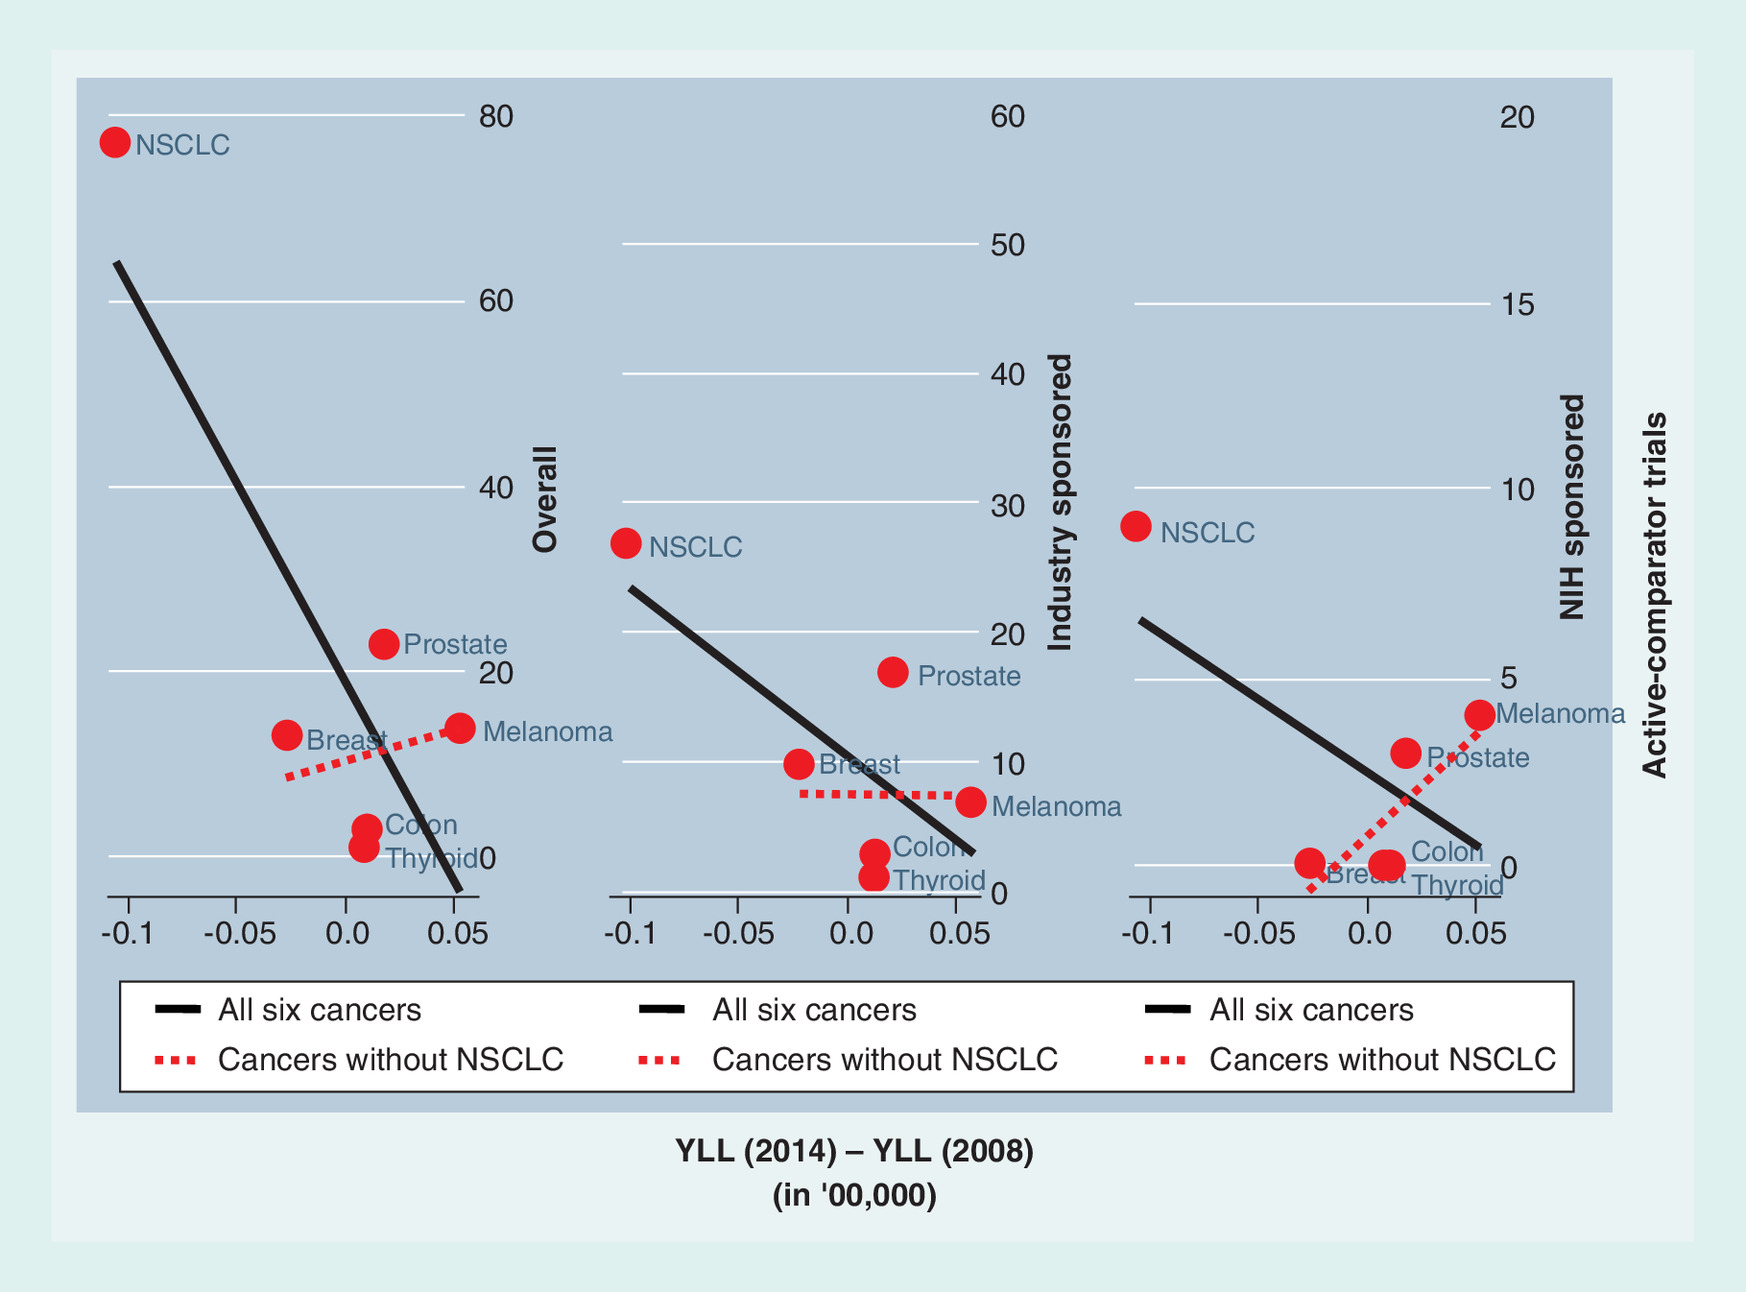
Figure 3. Relationship between cancer-specific total number of active-comparator trials initiated through 2013 using oncology drugs approved during 2008–2013 difference in years of life lost in 2014 versus 2008 by study sponsors.
NSCLC: Non-small-cell lung cancer; YLL: Years of life lost.
First draft submitted: 24 March 2016; Accepted for publication: 13 September 2016; Published online: 9 December 2016
Throughout much of the world, health has improved tremendously, and almost continuously, over time. Biomedical research has played a major role in these advances in health. That these improvements in health are important almost goes without saying, but a recent body of work, drawing on economic estimates of the value of life, has shown that these advances are about as important to increasing welfare over this period as increases in per capita income [1]. This has led to increases in research spending and to recognition that we may still spend less on biomedical research than is optimal given its benefits.
Further increases in spending, however, will not circumvent the question of how to best allocate that spending. Choices need to be made between basic research and clinical research, between different diseases, between different target outcomes within diseases and so on. Criteria to make these choices may also vary among stakeholders. Governmental agencies and researchers have consistently put forward the ‘burden of illness’ (BI) criterion as a means to assess the need for investing in research. Originating in the early 1960s and the 1970s, and pioneered by the director of the National Center for Health Statistics at that time, Dororthy Rice, BI studies aim to quantify the impact of diseases on patients’ lives compared with a healthy population [2,3]. Later, these methods were adopted by the World Bank to establish the World Development Report [4]. Although several enhancements to the methodology of BI studies have been made over the years, the most commonly used metric for BI studies still remains to be years of life lost (YLL), both as a population aggregate and on a per patient basis, due to a disease. In 1998, the Institute of Medicine, on the request of the Congress, evaluated priority-setting criteria for NIH funding and recommended greater consideration of disease burden [5]. Analyzes of data from 2006 revealed that, on average, NIH investment levels were positively associated with disease burden [6].
Research investments, however, have typically been lumped together, without a distinction between a research that develops innovations (basic sciences) versus a research that understands how an innovation, already developed, can best be used in a population (clinical or translational sciences). This distinction is important because, while it could be readily argued, and as Congress has argued in the past [5], that research investments to develop an innovation should follow population BIs, research investments in translational sciences must account for incremental returns to such investments, which may not be perfectly aligned with population BI. For example, an innovation in diabetes, which has a large population BI, may produce small incremental changes in the level of BI.
In this work, we explore the hypothesis that research investments in translational sciences follow anticipated returns of investment in the form of changes in BI, rather than absolute levels of BI. Moreover, we study whether these anticipated returns were based on retrospective changes in BI experienced or future changes in BI expected in the population. In addition, we explore whether such associations, or lack of associations, are driven by outlier diseases that dominate in the form of burden of disease.
We set out to understand these associations in the context of metastatic cancers. Cancer is still one of the leading causes of death, second only to heart disease. It is reasonable to infer that more people will live with and die from cancer in the future because of aging population [7,8]. Compared with the death rate in 2010, the age-adjusted mortality rate of cancer decreased by 2.4% in 2011 [9]. However, substantial heterogeneity in the mortality rates across specific types of cancer exists [7].
We examine research investments in pharmaceutical drugs, newly approved for these cancers. We quantify investments with the number of clinical trials started that were not used in the approval process of these drugs. Additionally, we also explore whether these patterns of investments are similar between NIH and industry. Last, we discuss how systematic tools such as value of information analysis can help guide these investments for better alignment with patient welfare.
Methods
To investigate the relationship between disease burden and the amount of investment, we estimated YLL and changes in these estimates over the last decade and counted the number of clinical trials involving newly approved pharmaceutical drugs for different cancer sites. We focused on six cancer sites, thyroid, melanoma, prostate, breast, colon and lung. These high-prevalence cancer sites were chosen because at least one new drug was approved between 2008 and 2013, and data from the SEER Cancer Statistics Review was available for computing YLL. Among cancer patients with bone metastases in the USA, approximately 68% of the cases are breast, prostate and lung cancers [10]. Additionally, four of these six cancers (breast, prostate, colon and rectum, and non-small-cell lung cancer [NSCLC]) accounted for 78.1% of cancers among untreated patients with metastatic cancers [11].
YLL represents a better metric of burden compared with number of deaths, which has been widely reported in the cancer literature, as it naturally gives more weight to deaths occurring at younger ages [12]. To our knowledge, this is the first study that associates investments in clinical trials to BI across specific cancer sites. We explored differences in patterns of investments by private versus public investors and among trials that had an active-comparator. Our analyzes shed light on the merit of using BI type analyzes for allocating research resources based on current allocations.
Years of life lost
We only focused on the adult population, that is, 20 years and older. YLL for each cancer was estimated separately for 2002, 2008 and 2014. Specifically, we obtained estimates of the total number of cancer-specific deaths in 2002, 2008 and 2014 reported in the literature [13–15]. We then distributed the total number from each year using the same age–gender-specific distribution of cancer deaths as reported in the SEER Cancer Statistics Review. We applied 2002–2006 SEER estimates for 2002 YLL, and 2006–2010 SEER estimates for both 2008 and 2014 YLL, in the absence of any newer data [16,17]. Finally, we calculate YLL by aggregating age–gender-specific life expectancy in the general population weighted by the number of age–gender-specific deaths for each cancer. We used the 2002 life table for calculating 2002 YLL and the latest available 2009 life table for the 2008 and 2014 YLL [18,19]. We calculated 6-year changes to YLL from 2002 to 2008 and from 2008 to 2014.
Investments in clinical trials evaluating pharmaceutical products for metastatic cancers
Since cancer deaths occur in patients with metastatic cancer (barring some misclassification in death records), and chemotherapies are some of the most widely used treatment during metastatic cancer, we focused our attention on drugs that were approved for metastatic cancer during the 6 years from 2008 through the end of 2013. Focusing on this period allowed us to associate these investments with the baseline YLL in 2008 but also changes before and after 2008 as discussed above. For each drug approved during 2008–2013 for treating metastatic cancer in any of the six cancer sites, we obtain the total number of clinical trials (randomized or single-arm, funded by NIH, private or other sources) from ClinicalTrials.gov, a public clinical trials registry. The inclusion criteria for selecting trials were that their ‘received dates’ and ‘start dates’ were before 1 January 2014 and their ‘primary completion dates’ were after the approval date for the specific drug (i.e., we rule out trials that were used to obtain approval). The definition of first received date is when the summary of a clinical trial was first submitted to ClinicalTrials.gov; start date means the data of enrollment for the first subject; and primary completion date is the date data were collected from the last subject for the primary outcome. We included trials that were continuing to enroll through the end of 2013. In addition, we excluded a clinical trial if its target population was not the specific metastatic cancer for which the drug was approved; if the study has been withdrawn before enrollment; if it completed before the approval date; and if the primary drug was compared with other nonapproved drugs for any indication. If a study compared two drugs that were both approved in the previous 5 years, and we associated the trial with the latest approved drug. The percentile distribution of the phases for the trials included in our study is provided in Table 1.
Erlotinib was not included in this study because its initial approval year for NSCLC was in 2004, when it was approved for the patients after failed chemotherapy, although it was approved for first-line treatment of NSCLC in 2013. Including erlotinib in the study would over count the number of clinical trials for lung cancer.
We classified the selected trials for each drug by funder types (industry, NIH or others) and also into those that had any active comparison (e.g., comparative effectiveness trials where comparators include all types of treatments including previously approved drugs and nondrug therapies such as surgery and radiation) versus placebo control or single-arm studies. The definition of industry included any pharmaceutical or biotechnological company. If the sponsor or collaborator of a clinical trial included both industry and NIH, we counted the trial as being in the industry category. If the sponsors or collaborators are neither industry nor NIH, the trial was categorized to other type of sponsors. Most other type sponsors were academic institutes or medical research centers.
Association of years of life lost & investment measures
We associated YLL and changes in YLL, as our independent variable, with number of clinical trials, as the dependent variable. We believe that translational clinical trials initiated during 2008–2013 could not have a direct effect on YLL during 2008–2014. Many of these trials were not even complete by the end of 2013. We used graphs to illustrate the association of the number of trials for each cancer site with total YLL and changes in YLL. These associations inform whether research investment decisions followed any of the YLL metrics and, if they did, which metric was most predictive of such investments. We distinguished these associations by comparative effectiveness research-specific investments and by funder types.
Results
Years of life lost
The number of deaths and the YLL by cancer site are reported in Table 2. Thyroid cancer had the least number of deaths and YLL while NSCLC had, by far, the most in any given year. However, comparing the 2008 estimates to the 2002 estimates, we found that during this period the number of deaths and YLL decreased only for prostate cancer, and colon and rectal cancer. The disease burden slightly increased for all other cancers during this period. In contrast, from 2008 to 2014, deaths and YLL decreased only for breast cancer and NSCLC but increased for others, including prostate, colon and rectal cancers. However, these increases did not offset the gains made during 2002–2008. Especially for prostate cancer, the increase in deaths during 2008–2014 appears to be concentrated among very elderly patients, since the change in YLL per additional death during this period was small compared with the same metric during 2002–2008.
The number of trials
In 6 years, 2008–2013, 17 new drugs were approved for one of the six cancers included in this analysis.
In total, 395 approval-unrelated trials for these drugs were started before the end of 2013 (Table 3). Of these, nearly 38% (148/395) were for drugs approved for NSCLC, reflecting the fact that investments in innovation may be following burden of disease. Across all cancer sites, besides NSCLC, <50% of the translational trials had active-comparators. For NSCLC, the high proportion of active-comparator trials was driven by the trials for Alimta injection. Table 3 also shows the number of trials by the type of sponsor. A majority of these translational trials, in all cancer sites except NSCLC, were sponsored by industry. In NSCLC, other sponsors were quite active.
Associations
Figure 1 illustrates the association between the total number of cancer-specific trials and the cancer-specific difference in YLL in 2008 versus 2002; absolute YLL in 2008; and difference in YLL in 2014 versus 2008. The associations appeared to be positive for both the difference in YLL in 2008 versus 2002 and the absolute YLL in 2008. However, the large number of trials in NSCLC drove these positive associations. When NSCLC was excluded, there was a null and a negative association with 2002–2008 difference and absolute 2008 YLL, respectively. In contrast, the number of cancer-specific translational trials was negatively associated with 2008–2014 difference in YLL when all six cancer sites were included, but a positive association emerged when NSCLC was excluded.
Figure 2A & B presents very similar relationships between industry- and NIH-sponsored trials, and the burden of illness measures. However, the number of industry-sponsored trials was more dispersed across cancer sites than NIH-sponsored trials. The number of industry-sponsored trials in prostate cancer and melanoma was similar to that in NSCLC.
Since investment in these trials appeared to be positively associated with contemporary changes in YLL (2008–2014) for most cancers, we looked at the association of the number of trials with active-comparators and this metric of BI by sponsor type (Figure 3). Sans NSCLC, overall we found a positive but much weaker association. However, there was a much stronger positive association between the number of NIH-sponsored active-comparator trials and contemporary changes in YLL. This was not the case with industry-sponsored active-comparator trials, where the association was slightly negative.
Discussion
Allocating scarce resources is a fundamental challenge for any research enterprise. Quantitative metrics are often useful to guide these difficult decisions. The BI measure is one such metric that is used to inform decisions about investment in research, since allocating investments to improve lives of those groups who have the greatest burden seems ethical [20,21]. However, distinction ought to be made between research investments that aim at new innovations versus those that attempt to understand how to best use a developed technology. The latter, some have argued, should be based on the potential for that technology itself rather than the burden in the population to which the technology is applied [22,23]. These discussions are currently ongoing within the NIH, as is evident from their recent request for input on strategies for optimizing the impact and sustainability of biomedical research [24].
In this work, we have shown that research investments on translational clinical trials with newly approved pharmaceuticals for metastatic cancer likely follow anticipated returns based on changes in YLL rather than the baseline YLL themselves or historical changes in YLL. One exception is NSCLC, where the burden is big enough to dominate investments irrespective of returns. We see similar patterns of investments by both NIH and industry. More importantly, we see that such patterns are more prominent for NIH than industry for trials involving active-comparators or comparative effectiveness trials, where incentives for industry are ambiguous since these trials present manufacturers with the risk of determining that their product is inferior to a competitor's product [25]. NIH, on the other hand, is free to respond to changes in BI without potentially negative financial consequences.
Conclusion
We conclude that investments were made in anticipation to the changes in BI because the results from the trial investments during 2008–2013 are less likely to produce the changes in BI during the same period. Most trials were still ongoing or had just completed at the end of this period. Hence, it is not the number of trials producing changes in BI, but anticipated changes in BI-driving investments in the number of trials.
There are some limitations in this study. First, we used lung and bronchus cancer data to estimate YLL for NSCLC. Even though 80% of lung cancer belongs to NSCLC, the number of deaths and age distribution for NSCLC may be different from lung cancer. However, data for lung and bronchus cancer is the best approximation we have for NSCLC. Second, we counted the number of clinical trials based on those that were registered by investigators on ClinicalTrials.gov. We assumed the information on the website is reliable. However, the registry may not be of high quality for each trial, or the investigators may not have updated their study regularly, which would be a source of potential bias for counting the number of trials. Also, our approach may have a censoring issue because we count the number of trials after the drugs were approved until December 2013. The number of clinical trials could be underestimated for several drugs that were approved in 2013: it could affect the association between burden and investment. However, since the melanoma and prostate sites are the ones that would be most affected by such underestimation, our results on the strength of associations are conservative.
Our results have implications for future research. It has previously been thought that current levels of BI affect decisions for research investment. However, it would be more efficient if decisions about investment in research on translational science are based on anticipated changes in BI. This paper demonstrates that, among the disease sites considered, investment in translational research does seem to follow anticipated changes in BI rather than BI level, unless the BI levels are enormous. Future studies that can more rigorously help funders of translational sciences to systematically estimate anticipated benefits of research and help them prioritize research investments in the most efficient way will be very valuable. To maximize the benefits of research spending, we need tools to determine where research is likely to yield the greatest benefits. Estimates of the benefits of research also serve the added role of documenting the likely value of research that we cannot currently fund given the best possible allocation of resources for research. This information may help increase the pool of resources available for research of any type. Determining the value of research is not easy. Indeed, uncertainty is an intrinsic aspect of research, making it impossible to know its final value with certainty. However, this does not imply that individual research opportunities cannot be valued or prioritized. Indeed, the problem of investing wisely in biomedical research is not unlike the problem faced by investors when they choose to invest in stocks or other business assets in the face of uncertain returns. Thus, the intrinsic uncertainty of research does not preclude rational investment decisions. In healthcare, we trust these investment decisions to the knowledge, efforts and wisdom of scientists, policy makers, and business and philanthropic leaders who review research proposals for the public, private philanthropic and business entities that invest in health-related research. Additionally, developing and using quantitative measures such as expected value of information metrics can help guide these decisions and create a more productive dialogue on research investments across stakeholders [26,27].
Future perspective
Public and private funders would look for ways to understand the value of research systematically before making research investments. Tools like value of information can help in this regard in creating a portfolio of research investments for funders based on the risk and rewards of such investments. Such systematic and quantitative assessments combined with qualitative evaluation for the importance of research projects can help improve patient welfare at a faster pace in the long run.
| Stage | Number of trials | Percentage (%) |
|---|---|---|
| Not available | 42 | 10.63 |
| Phase 0 | 3 | 0.76 |
| Phase I | 64 | 16.20 |
| Phase I/Phase II | 21 | 5.32 |
| Phase II | 174 | 44.05 |
| Phase II/Phase III | 7 | 1.77 |
| Phase III | 69 | 17.47 |
| Phase IV | 15 | 3.80 |
| Cancers | 2002 | 2008 | 2014 | Change 2008–2002 | Change 2014–2008 |
|---|---|---|---|---|---|
| Deaths | |||||
| Thyroid cancer | 1300 | 1590 | 1890 | 290 | 300 |
| Melanoma | 7400 | 8420 | 9710 | 1020 | 1290 |
| Prostate cancer (male) | 30,200 | 28,660 | 29,480 | -1540 | 820 |
| Breast (female) | 39,600 | 40,480 | 40,000 | 880 | -480 |
| Colon and rectum cancer | 56,600 | 49,960 | 50,310 | -6640 | 350 |
| Lung and bronchus cancer (NSCLC) | 154,900 | 161,840 | 159,260 | 6940 | -2580 |
| Years of life lost (in 10,000 years) | |||||
| Thyroid cancer | 0.46 | 0.57 | 0.68 | 0.11 | 0.11 |
| Melanoma | 3.39 | 3.86 | 4.45 | 0.47 | 0.59 |
| Prostate cancer (male) | 8.64 | 7.44 | 7.66 | -1.2 | 0.22 |
| Breast (female) | 18.26 | 20.83 | 20.58 | 2.57 | -0.25 |
| Colon and rectum cancer | 18.42 | 17.75 | 17.88 | -0.67 | 0.13 |
| Lung and bronchus cancer (NSCLC) | 64.64 | 69.27 | 68.17 | 4.63 | -1.1 |
NSCLC: Non-small-cell lung cancer.
| Cancer site | Approved year | Drug | Number of trials | Type of comparator | Type of sponsor, n (%) | |||||
|---|---|---|---|---|---|---|---|---|---|---|
| Screened | Included | Active-comparator | Placebo or single arm | Pr (active) | Industry | NIH | Other | |||
| Thyroid | 16 | 1 | 15 | 0.06 | 9 (56.25) | 5 (31.25) | 2 (12.5) | |||
| 2011 | Vandetanib tablets | 106 | 7 | 1 | 6 | 0.14 | 6 (85.7) | 1 (14.3) | 0 (0) | |
| 2012 | Cabozantinib | 58 | 7 | 0 | 7 | 0 | 3 (42.9) | 3 (42.9) | 1 (14.3) | |
| 2013 | Sorafenib | 16 | 2 | 0 | 2 | 0 | 0 (0) | 1 (50) | 1 (50) | |
| Melanoma | 92 | 14 | 78 | 0.15 | 52 (56.52) | 9 (9.78) | 31 (33.7) | |||
| 2011 | Ipilimumab injection | 187 | 34 | 7 | 27 | 0.21 | 11 (32.4) | 5 (14.7) | 18 (52.9) | |
| 2011 | Vemurafenib tablets | 87 | 35 | 2 | 33 | 0.06 | 23 (65.7) | 0 (0) | 12 (34.3) | |
| 2013 | Trametinib | 79 | 16 | 5 | 11 | 0.31 | 12 (75) | 3 (18.8) | 1 (6.3) | |
| 2013 | Dabrafenib | 50 | 7 | 0 | 7 | 0 | 6 (85.7) | 1 (14.3) | 0 (0) | |
| Prostate | 75 | 23 | 52 | 0.31 | 58 (77.33) | 5 (6.67) | 11 (14.67) | |||
| 2008 | Degarelix | 73 | 36 | 10 | 26 | 0.28 | 28 (77.8) | 2 (5.6) | 6 (16.7) | |
| 2010 | Sipuleucel-T | 30 | 11 | 3 | 8 | 0.27 | 9 (81.8) | 1 (9.1) | 1 (9.1) | |
| 2012 | Enzalutamide | 63 | 21 | 8 | 13 | 0.38 | 14 (66.7) | 2 (9.5) | 4 (19) | |
| 2013 | Radium Ra 223 dichloride | 23 | 7 | 2 | 5 | 0.29 | 7 (100) | 0 (0) | 0 (0) | |
| Breast | 46 | 13 | 33 | 0.28 | 35 (76.09) | 2 (4.35) | 9 (19.57) | |||
| 2010 | Eribulin mesylate | 83 | 29 | 6 | 23 | 0.21 | 23 (79.3) | 1 (3.4) | 5 (17.2) | |
| 2013 | Ado-trastuzumab emtansine | 41 | 17 | 7 | 10 | 0.41 | 12 (70.6) | 1 (5.9) | 4 (23.5) | |
| Colon | 18 | 3 | 15 | 0.17 | 16 (88.89) | 0 (0) | 2 (11.11) | |||
| 2012 | Regorafenib | 62 | 18 | 3 | 15 | 0.17 | 16 (88.9) | 0 (0) | 2 (11.1) | |
| NSCLC | 148 | 77 | 71 | 0.52 | 61 (41.22) | 18 (12.16) | 69 (46.62) | |||
| 2008 | Alimta injection | 343 | 118 | 69 | 49 | 0.58 | 38 (32.2) | 17 (14.4) | 63 (53.4) | |
| 2011 | Crizotinib | 62 | 11 | 4 | 7 | 0.36 | 9 (81.8) | 1 (9.1) | 1 (9.1) | |
| 2013 | Afatinib | 105 | 19 | 4 | 15 | 0.21 | 14 (73.7) | 0 (0) | 5 (26.3) | |
NSCLC: Non-small-cell lung cancer; Pr: Proportion.
Although US congress has suggested that research investments should align with burden of illness (BI) for a disease, investments in translational research may deviate from such principles, since returns to such research may not align with BI.
We tested this hypothesis using the association between the number of nonapproval trials for pharmaceuticals started during 2008–2013 for six prevalent metastasis cancers and their respective levels of burden (i.e., years of life lost) in 2008 and also retrospective (2002–2008) and contemporary (2008–2014) changes in burden.
Investment in these trials seems to be positively associated only with contemporary changes in the BI and not the level of the BI itself. It also does not seem to be driven by historical changes in BI. Since, due to timing, these trial results are less likely to produce these changes in burden, this association suggests that investments were made where bigger gains were anticipated.
A similar overall association was observed for both NIH- and industry-sponsored trials. However, for comparative effectiveness research trials, which carry active-comparators, the association with contemporary changes was much stronger for NIH-funded trials compared with industry-sponsored trials.
Investment in translational research is less likely to follow BI levels unless a disease presents itself with a disproportionate share of burden (e.g., metastatic non-small-cell lung cancer). Systematic methods, such as value of information analysis, which can represent expected returns from specific investments, can help guide investment decisions in translational health sciences and generate a productive dialogue across stakeholders.
Disclaimer
The opinions expressed in this article are those of the author and do not necessarily reflect the views of Future Medicine Ltd.
Author contributions
W-J Wang helped conceptualize the ideas, carried out the analyzes and helped in writing the paper. J Robertson and A Basu helped with conceptualizing ideas, interpreting results and writing the paper.
Financial & competing interests disclosure
A Basu acknowledges support from NIH studies (U01AG047109, PI: Veenstra; R01HL126804, PI: Basu). J Robertson acknowledges support from K12HS022982 fellowship from the Agency for Healthcare Research and Quality. The authors have no other relevant affiliations or financial involvement with any organization or entity with a financial interest in or financial conflict with the subject matter or materials discussed in the manuscript apart from those disclosed.
No writing assistance was utilized in the production of this manuscript.
References
Papers of special note have been highlighted as: • of interest; •• of considerable interest
1.
Murphy KM, Topel RH. The economic value of medical research. In: Measuring the Gains from Medical Research: an Economic Approach. Murphy KM, Topel RH (Eds). University of Chicago Press, IL, USA (2003).
• Economic model based on fundamental principles approach to show the basis for calculating the average value of medical research, and was cited as a rationale for doubling the NIH budget.
2.
Rice DP. Estimating the cost of illness. Health Economics Series No. 6. US Public Health Services, Washington, DC, USA (1966).
3.
Rice DP, White KL, Feldman JJ. The Current Burden of Illness in the United States. Institute of Medicine, National Academy of Sciences, Washington, DC, USA (1977).
4.
World Bank, World Development Report 1993: Investing in Health. Oxford University Press for the World Bank, NY, USA (1993).
5.
Scientific opportunities and public needs: improving priority setting and public input at the NIH. 1998. Priority Setting Committee, Institute of Medicine, National Academy Press. www.nap.edu.
6.
Gillum LA, Gouveia C, Dorsey ER et al. NIH disease funding levels and burden of disease. PLoS ONE 6(2), e163837 (2011).
7.
SEER cancer statistics review, 1975–2011. National Cancer Institute, MD, USA (2014). http://seer.cancer.gov/csr/1975_2011/.
• Provides age distribution by gender for each cancer site.
8.
Cancer treatment and survivorship facts & figures 2014–2015. American Cancer Society, GA, USA (2014). www.cancer.org/acs/groups/content/@research/documents/document/acspc-042801.pdf.
• Comprehensive survival estimates information for different cancers in the USA.
9.
Hoyert DL, Xu J. Deaths: preliminary data for 2011. National Vital Statistics Reports. National Center for Health Statistics, MD, USA, 61(6), October 10 (2012). http://www.cdc.gov/nchs/data/nvsr/nvsr61/nvsr61_06.pdf.
10.
Li S, Peng Y, Weinhandl ED et al. Estimated number of prevalent cases of metastatic bone disease in the US adult population. Clin. Epidemiol. 4, 87–93 (2012).
11.
Small AC, Tsao CK, Moshier EL et al. Prevalence and characteristics of patients with metastatic cancer who receive no anticancer therapy. Cancer 118(23), 5947–5954 (2012).
12.
Brown ML, Lipscomb J, Snyder C. The burden of illness of cancer: economic cost and quality of life. Ann. Rev. Public Health 22, 91–113 (2001).
• Classic article laying out the methods and estimates for burden of illness in cancer.
13.
Jemal A, Thomas A, Murray T, Thun M. Cancer statistics, 2002. CA Cancer J. Clin. 52(1), 23–47 (2002).
14.
SEER cancer statistics review 1975–2005 – Table I-1, estimated new cancer cases and deaths for 2008. National Cancer Institute, MD, USA. http://seer.cancer.gov/csr/1975_2005/.
• Based on November 2007 SEER data submission, posted to the SEER website, 2008.
15.
American Cancer Society. Cancer facts & figures 2014. American Cancer Society, GA, USA, 2014. www.cancer.org/acs/groups/content/@research/documents/webcontent/acspc-042151.pdf.
16.
SEER cancer statistics review 1975–2006 – Table 1.12, age distribution of deaths by site, 2002–2006. National Cancer Institute, MD, USA. http://seer.cancer.gov/csr/1975_2006/.
• Based on November 2008 SEER data submission, posted to the SEER website, 2009.
17.
SEER cancer statistics review 1975–2010 – Table 1.13, age distribution of deaths by site, 2006–2010. National Cancer Institute, MD, USA. http://seer.cancer.gov/csr/1975_2010/.
• Based on November 2012 SEER data submission, posted to the SEER website, April 2013.
18.
Arias E. United States life tables, 2002. National Vital Statistics Reports, vol. 53, no. 6. National Center for Health Statistics, MD, USA (2004).
19.
Arias E. United States life tables, 2009. National Vital Statistics Reports, vol. 62, no 7. National Center for Health Statistics, MD, USA (2014).
20.
Rawls J. A Theory of Justice. Harvard University Press, Cambridge, MA, USA (1971).
21.
Williams A. Intergenerational equity: an exploration of the ‘fair innings’ argument. Health Economics 6(2), 117–132 (1997).
22.
Claxton K. The irrelevance of inference: a decision-making approach to the stochastic evaluation of health care technologies. J. Health Econ. 18(3), 341–364 (1999).
• Classic article introducing concept of value of information analysis for funding medical research.
23.
Meltzer D. Addressing uncertainty in medical cost-effectiveness analysis implications of expected utility maximization for methods to perform sensitivity analysis and the use of cost–effectiveness analysis to set priorities for medical research. J. Health Econ. 20(1), 109–129 (2001).
• Classic article providing economic foundation for value of information analysis.
24.
Lorsch J, Rockey S. Give input on strategies for optimizing the impact and sustainability of biomedical research. Rock Talk, National Institutes of Health. https://nexus.od.nih.gov/all/2015/04/02/give-input-on-strategies-for-optimizing/?utm_source=nexus&utm_medium=email&utm_content=nihupdate&utm_campaign=mar15.
25.
Basu A, Meltzer D. Private manufacturers’ thresholds to invest in comparative effectiveness trials. Pharmacoeconomics 30(10), 859–868 (2012).
26.
Meltzer DO, Hoomans T, Chung JW, Basu A. Minimal modeling approaches to value of information analysis for health research. Med. Decis. Making 31(6), E1–E22 (2011).
•• Important methodological contributions on carrying out value of information analysis without building extensive simulation models.
27.
Carlson JJ, Thariani R, Roth J et al. Value-of-information analysis within a stakeholder-driven research prioritization process in a US setting: an application in cancer genomics. Med. Decis. Making 33(4), 463–471 (2013).
•• The first demonstration of the use of value of information analysis methods to value prospective research and how it affected decision making on prioritization of research in the USA.
Information & Authors
Information
Published In
Copyright
© Future Medicine Ltd.
History
Published online: 9 December 2016
Keywords:
Topics
Authors
Metrics & Citations
Metrics
Article Usage
Article usage data only available from February 2023. Historical article usage data, showing the number of article downloads, is available upon request.
Citations
How to Cite
Burden of illness and research investments in translational sciences for pharmaceuticals in metastatic cancers. (2016) Journal of Comparative Effectiveness Research. DOI: 10.2217/cer-2016-0021
Export citation
Select the citation format you wish to export for this article or chapter.
Citing Literature
- Yuyang Su, Weiqing Qian, Xiaohan Cao, Hongying Wang, Xiaocan Lei, Weidong Gong, Jialin Hu, Global research hotspots and trends in polysaccharide anti-tumor therapy: A systematic bibliometric analysis and review, Journal of Agriculture and Food Research, 10.1016/j.jafr.2026.102635, 26, (102635), (2026).
- Jakob V E Gerstl, Mackenzie Price, Joshua D Bernstock, Carol Kruchko, Lennard Spanehl, Paramesh V Karandikar, Jill S Barnholtz-Sloan, Timothy R Smith, Elizabeth B Claus, Quinn T Ostrom, Years of life lost due to central nervous system tumor subtypes in the United States, Neuro-Oncology, 10.1093/neuonc/noaf142, 27, 10, (2738-2746), (2025).