Using primary care electronic health record data for comparative effectiveness research: experience of data quality assessment and preprocessing in The Netherlands
Abstract
Aim: Details of data quality and how quality issues were solved have not been reported in published comparative effectiveness studies using electronic health record data. Methods: We developed a conceptual framework of data quality assessment and preprocessing and apply it to a study comparing angiotensin-converting enzyme inhibitors with angiotensin receptor blockerss on renal function decline in diabetes patients. Results: The framework establishes a line of thought to identify and act on data issues. The core concept is to evaluate whether data are fit-for-use for research tasks. Possible quality problems are listed through specific signal detections, and verified whether they are true problems. Optimal solutions are selected for the identified problems. Conclusion: This framework can be used in observational studies to improve validity of results.
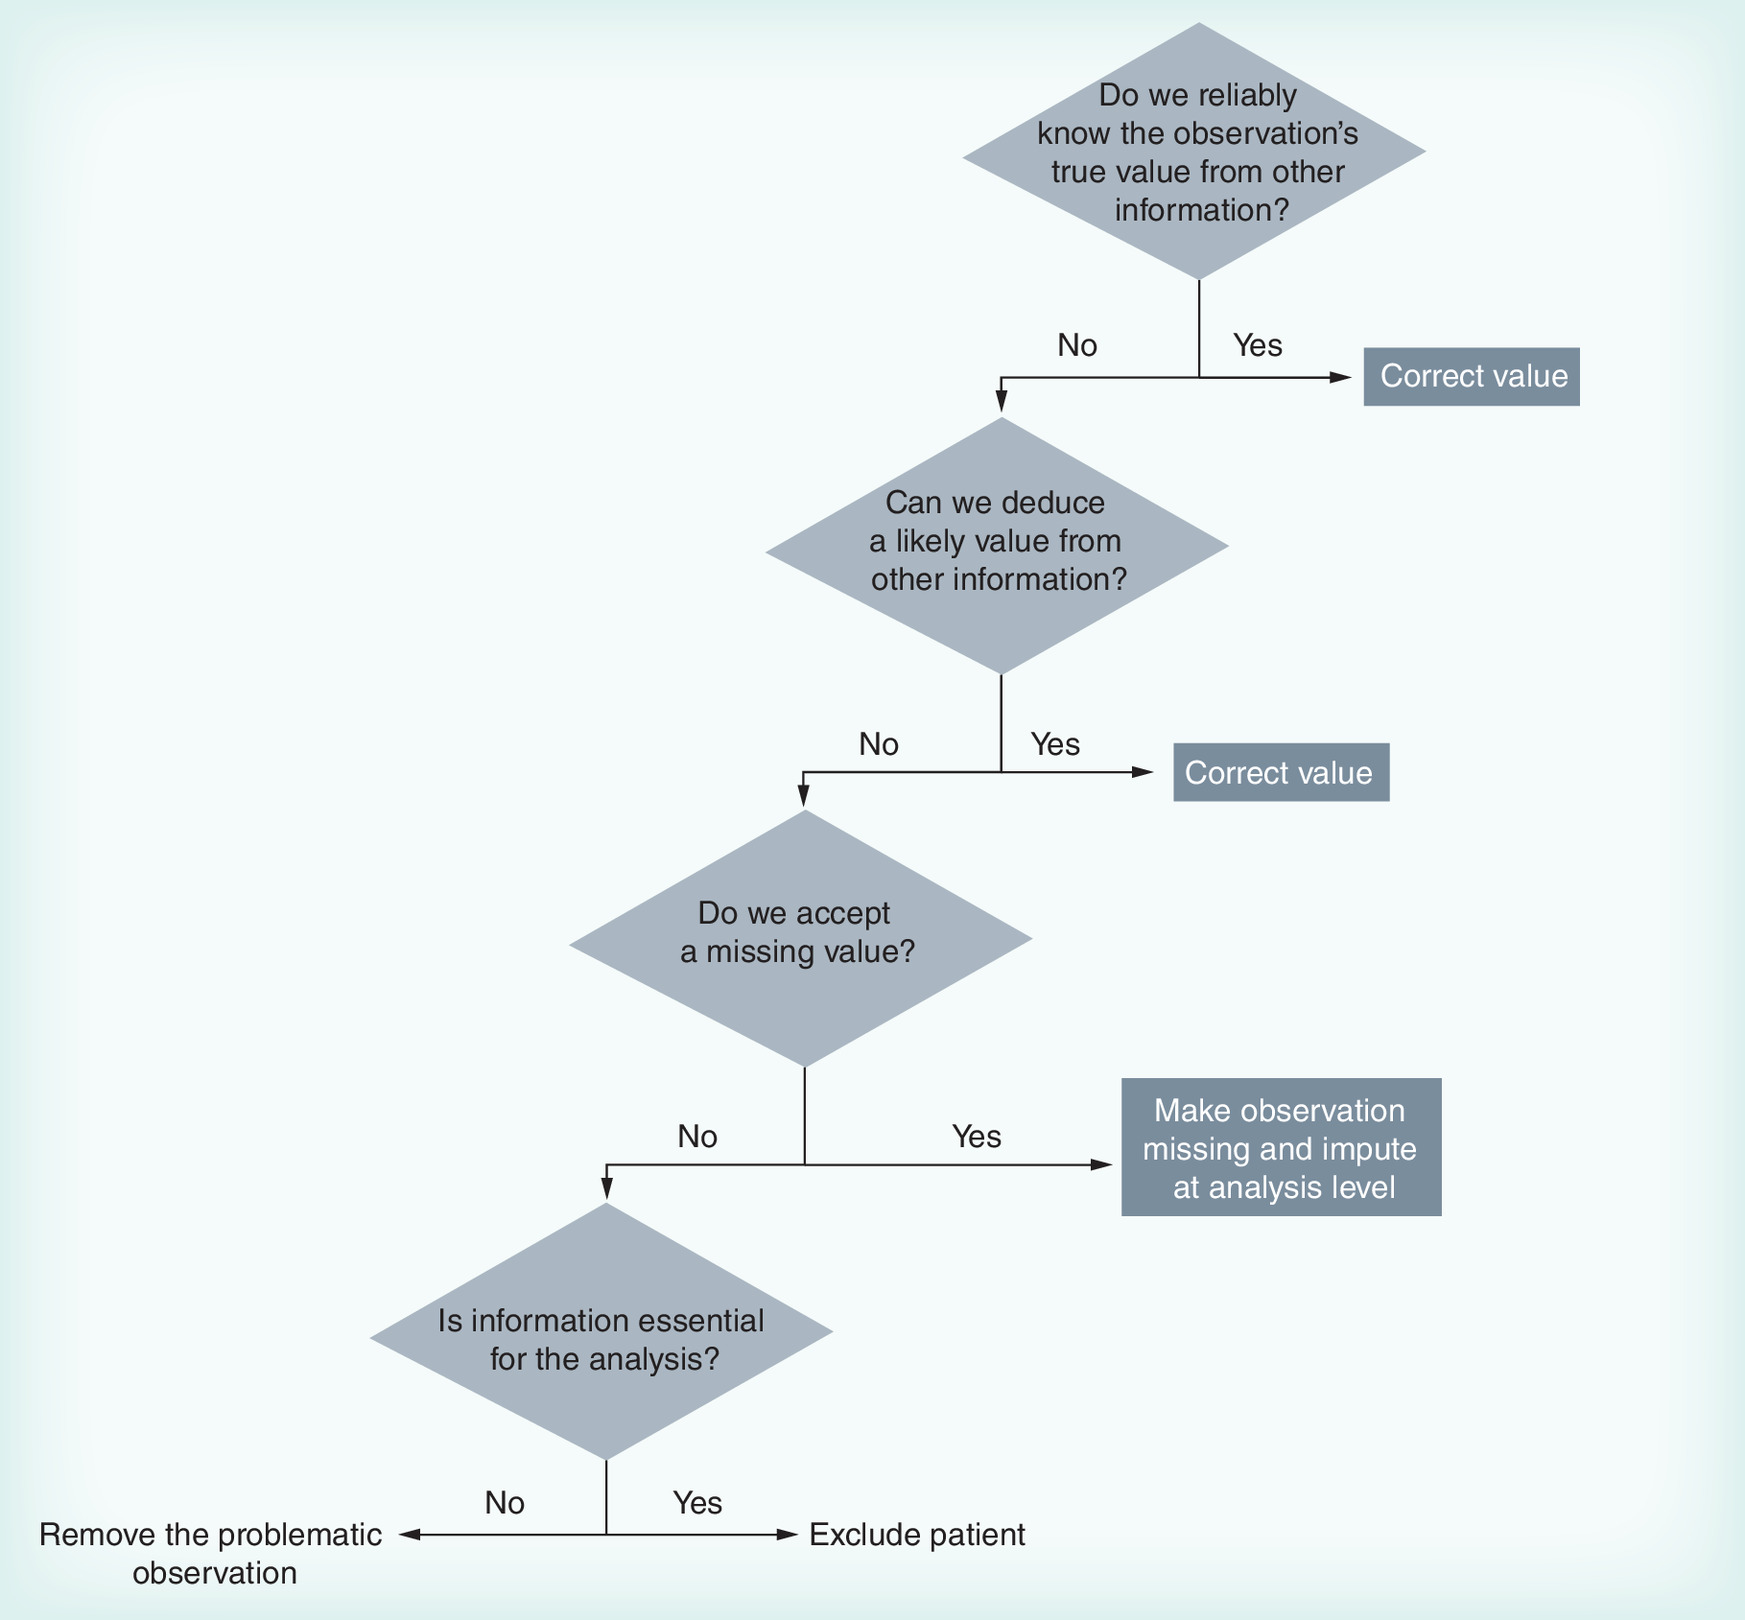

Figure 2. Data preprocessing flow in the case study.
ACEi: Agiotensin-converting enzyme inhibitor; ARB: Angiotensin receptor blocker; DDD: Defined daily dose; eGFR: Estimated glomerular filtration rate.
First draft submitted: 22 December 2015; Accepted for publication: 10 April 2016; Published online: 27 June 2016
Comparative effectiveness research (CER) is the generation and synthesis of evidence that compares the benefits and harms of alternative methods to prevent, diagnose, treat and monitor a clinical condition or to improve the delivery of care [1]. In recent years, the interest in CER, with growing demand for observational data to support critical decision-making, has increased the exploration of information sources other than randomized clinical trials [2]. Although observational data have limitations such as potential for biases [3], it has long been recognized for offering useful information on real-world interventions and health outcomes [4]. With the development of health information technology, an increasing number of healthcare systems have implemented electronic health record (EHR) systems in support of healthcare delivery and health services research [5]. Compared with the widely used administrative data or insurance claims, EHR data provide a more detailed picture of patient-level treatments and outcomes [6,7]. This provides additional opportunities for CER [8].
Although the increasing availability of EHR represents opportunities to study drug use patterns or drug effects in routine clinical practice, CER using EHR data is methodologically complex and still faced with challenges. This brings forward a request of high-quality data and open data processing approaches to answer the most important CER questions [9].
In data quality we can distinguish several dimensions. Accuracy and completeness have been mentioned as the two most important dimensions [10,11]. Recent clinical and health services research have adopted the ‘fit-for-use’ concept proposed in the information sciences literature [12]. This concept entails that the dimensions of data quality do not have objective definitions, but are task-dependent [12,13]. Thus, accuracy should be considered not only as the extent to which data are in conformity to the truth [14], but also as the extent to which the data are suitable for a specific study's requirements. Analogously, completeness is not only the extent to which all necessary data that could have been registered have actually been registered [14], but also whether all required data are available. When EHR data are used in CER, an underlying assumption is that they are of sufficient quality [15], that is, accurate and complete. Both dimensions have been shown to be relevant problems in some American EHR datasets [16–18], and should receive attention in any CER study.
To date, the literature on data quality in CER focuses primarily on the infrastructure for carrying out studies, such as developing transparent policies and practices, clarifying data control ownership and much less on using EHRs in different research questions at a methodological level [9,19–22]. Published CER studies using EHRs seem to concentrate on thoroughly reporting design and analytical approaches to enable causal inferences in the absence of randomization, with very limited reporting or discussion of data quality issues. To our knowledge, details of data quality issues and these were solved have not been reported in published CER studies. Although reported guidelines of CER [23–25] state clearly the importance of ensuring quality data, those recommendations remain general and abstract. Because of the lack of ‘hands on’ information, it is difficult to build a standardization of data quality assurance on others’ experiences.
Although solutions for data quality issues will vary between individual studies using different databases, detailed description of data quality assessment and actions to ensure high-quality datasets for research should be available. Transparency of addressing data quality issues for EHR data will help to improve the consistency in computing quality measures and to facilitate best practices and trust in the clinical evidence based on use of EHR data [26,27].
Objective
In this paper, we apply a general framework to illustrate the problems and solutions of data quality assessment and preprocessing. The framework helps to establish a line of thought to identify and act on data issues, following systematic checking of assumptions underlying the use of the EHR data. We use a CER study that compares effectiveness of angiotensin-converting enzyme inhibitors (ACEis) with angiotensin receptor blockers (ARBs) on deterioration of renal function in diabetes using primary care EHR data in The Netherlands to explain and illustrate the application of the framework.
Conceptual framework of data quality assessment & preprocessing
Our proposed framework, based on the ‘fit-for-use’ concept, consists of the following four steps (Table 1):
Define the general assumptions: data are sufficiently accurate and complete;
Define requirements for the data based on the research task;
Generate listings of observations with possible quality problems and verify whether the general assumptions (step 1) are not true for those observations;
Select the best strategies to handle the data with verified quality problems (e.g., correct data or adopt an analytical approach).
Assumptions
The assumption prior to data quality assessment is that the data are fit for the research purpose. With the study setting at hand, the data are believed to be accurate and complete enough to provide accurate findings.
Requirements
The concept of ‘fit-for-use’ emphasizes that different research task may have different criteria for data features [27]. Before data quality can be assessed, we need to define the data features, that is, the information required to answer the research questions with the chosen design (examples in Box 1). The next step is to define the granularity, that is, the level of detail, required for each piece of information (examples in Box 1).
Assumption falsification
The purpose of this step is to identify required data that do not meet the general assumptions. This is done by collecting evidence of inaccurate and/or incomplete information.
Data in EHR are registered to document and support clinical care, and generally do not have a research purpose. Therefore, uniformity of information may be problematic. Even using a highly structured data entry interface does not guarantee unambiguously structured data [28]. Also, information often resides in unstructured parts of the EHR like text notes [10], which requires specific extraction techniques that by themselves can cause inaccuracy.
Prior knowledge of the origin of the data, that is, specifics of its use and how it was registered and collected can be very useful in this. Knowledge of known mechanisms that could cause data quality problems and how these problems are presented in the datasets, can be used to identify specific problems.
Important in this step is that observations with possible quality problems are listed: signals. A signal can be generated by a simple check for impossible values (e.g., a blood pressure [BP] of over 400 mmHg) or through more complex pattern analyses (e.g., an impossible change in body mass over time). Such a signal is the first indication that the general assumptions may not be true, but in many cases additional proof is needed to judge the information invalid. Efficiency of signal detection should be considered as well, meaning that signals need to be sensitive but also specific enough to avoid spending too much time evaluating false positive ones. The decision of desired sensitivity of signals should be made based on the expected impact of residual quality problems on the outcomes of the analyses (examples in Box 2).
For the verification of signals (is it a true problem, or a false one?), it is helpful to consider likely causal mechanisms. For example, an unlikely value (e.g., a systolic BP of 14) could be caused by a typing error, or a different unit of measure (cmHg instead of mmHg). Realizing such mechanisms can help in looking for additional evidence to confirm the problem, and come to a valid solution. Such evidence can come from additional data not in the datasets (e.g., the source data, by for example, confirming that the healthcare provider of this patient is known to use a different unit sometimes), or from associations with other information in the datasets (e.g., the corresponding diastolic BP also appearing as a very low number).
It should be clear that the purpose of this exercise is not collecting evidence that an observation is valid (because that was the assumption we started with), but to prove that it is a true quality problem that needs to be handled.
Problems correction
Data quality preprocessing in a case study
We use a case study to describe how the conceptual framework can be used in CER. The study compares ACEis with ARBs on renal function decline in patients with Type 2 diabetes mellitus in primary care in The Netherlands [29]. Included are initial users of either drug class between 2007 and 2012. Renal function decline was measured by combining estimated glomerular filtration rate and urinary albumin secretion into five renal function stages.
Patients were followed from the initiation of ACEi/ARB until the first occurrence of: reaching the outcome: confirmed renal function decline, defined by two consecutive stage observations worse than baseline; switching to the other drug; moving out of the general practice; death and end of data availability.
To minimize confounding by indication, patients starting on ACEi and ARB treatment were matched on a propensity score (PS). The time to renal function decline was analyzed using an extended Cox model adjusted for time-varying covariates in the matched cohort.
Data source
We used data from the Groningen Initiative to Analyse Type 2 diabetes Treatment (GIANTT) database, which contains anonymized data retrieved from EHRs of general practitioners in The Netherlands using an automated and validated method [30].
We used data on demographic characteristics (age, gender, time since diabetes diagnosis), risk factor measurements (blood pressure, HbA1c, lipid profile, serum creatinine, urinary albumin secretion, BMI and smoking status), cardiovascular comorbidities as well as prescriptions of all antihypertensive medications.
During the regular data management activities at the central level of GIANTT, several quality issues have been handled already. Completeness of comorbidity codes is increased by semiautomatic coding of verbal diagnosis information. Laboratory test results registered in free text parts of the EHR are extracted. Correctness of measurement outcomes are verified and corrected using an advanced data validation process, using a set of signal-generating data pattern analyses to identify possible problems that are handled manually. Missing prescription attributes (e.g., ATC codes, numerical daily use information, drug dosage) are partly supplemented using, among others, available national medication databases. Correctness of prescription attributes are verified using a set of signals-generating pattern analyses and possible problems are handled manually.
Application of conceptual framework
Assumptions
We assume the data obtained from the general practices in the GIANTT database are accurate and complete for the case study.
Requirements
First we determine what kind of information is needed to answer the research question with the chosen design.
We need all renal function observations and medication exposure to ACEis/ARBs and comedications during follow-up for the time-to-event outcome. Since the study design includes adjustment for time-varying covariates, all observations during follow-up of these covariates are required. As for the PS-matching design, we need baseline values of renal function, a set of demographic and biomarker values, comorbidities and comedication use (Table 2).
The second step is to define the needed granularities of the required data. For the longitudinal analysis, we require all estimated glomerular filtration rate and albuminuria values and dates during follow-up obtained from a set of laboratory test results, that is, serum creatinine, proteinuria spot or per 24-h or albumin/creatinine ratio. The exposure of medication requires that we know on what day the patient was exposed to how much medication. Thus, we required information on daily dosage, duration and start date of all ACEi/ARB and comedication. For the time-varying covariates we need result and dates of all measurements and new diagnoses. For the PS estimation, we require the last observation of renal function and biomarker values during the year before ACEi/ARB initiation as well as comorbidities and comedication history as binary indicators.
Assumption falsification
For both assumptions of accuracy and completeness, we followed the framework through three substeps: summarize probable causal mechanisms of data quality issues based on prior knowledge, generate signals to identify possible problems and verify that the signals are true problems or not. For this source data in the GIANTT database was available through visualization software, providing quick insight into contextual information or additional attributes (e.g., unit of measurement), but may also other clinical conditions of a patient.
We identified three important mechanisms that affect data accuracy: typing errors, date misclassification due to registering older observations in recent narratives (historical records) and inconsistent use of measurement units.
We generated signals to identify observations with unreasonable values, rapid value change in time, impossible dates and repetitive prescriptions. We used source data to verify the accuracy assumption violation. For example, HbA1c observations with values above 20 are listed as signals. A signal would be verified as a true problem if additional evidence is available, for example, the use of mmol/mol as unit instead of percentage, or the value represents an impossible peak compared with the neighboring values.
As for the assumption of completeness, we know that many patients temporarily move out of the general practitioners practice due to an institutionalization. This can present itself as ‘concomitant missingness’: sets of observations missing simultaneously in a period. Signals designed to detect these patterns were used as well.
Problems correction
We followed the procedure of the decision tree previously mentioned to solve true problems verified after assumption falsification.
For example, if reliable contextual information from source data showed that HbA1c observations with values above 20 were registered using mmol/mol as the unit, we converted them to the correct unit used in the study dataset. Missing dosages of study medication were imputed from neighboring prescriptions in case of stable dosage trajectories. In case this was not possible, and the prescription was within the follow-up period, we excluded the patient from the analysis, since we did not accept possible misclassification in drug exposure. For comedication we accepted some misclassification, by also imputing missing dosages from neighboring prescriptions in case of an instable trajectory, since excluding a prescription altogether would result in more exposure misclassification than a deviation from the true dosage.
Biomarkers with accuracy problem that could not be reliably solved were made missing, because we judged removing individual observations to have limited effect on the results, since the analysis partly solved eventual bias introduced. Baseline missing values were imputed using multiple imputation during the analysis, and removed time-varying biomarker information was by design imputed by carrying the last observation forward.
Confirmed concomitant missingness resulted in exclusion of the patient from the cohort, since serious misclassification of both study drug and renal function assessments could be expected. Also, such periods of data absence could easily lead to erroneous identification of a new user, in case the concomitant missingness period is at least as long as the defined washout period to consider a patient an initial user.
To quantify medication exposure over time, we need the prescription information to reflect actual drug use. However, prescription patterns are a result of usage, early refills, stockpiling, dosage changes as well as artifacts. Therefore, extensive preprocessing of the prescription data was done, following a previously described method [31].
The entire data quality preprocessing procedures applying the conceptual framework are summarized in Table 3. Based on those procedures, the initial cohort extracted for the case study which included 6800 patients was adjusted to the analysis cohort that included 3633 patients with improved data quality in accuracy and completeness (Figure 2).
Discussion
With the growing adoption of EHRs in CER, concern about the quality of EHR data has increased. By providing ‘hands on’ information on the application of a general framework, we showed the usefulness of the ‘fit-for-use’ approach in describing data quality issues and their solutions. Such detailed information on data quality assessment provides the information that guidelines’ [23–25] stress is needed to ensure the validity of study results and improve the appropriateness of the use of EHR data in different settings.
For large-scale CERs, especially multisite studies or studies in distributed data networks, some frameworks and recommendations were published to support the improvement of assessing and reporting the data quality issues [27,32,33]. Those recommendations provide useful key rules which aim at different data quality dimensions. But still, there is a need to develop a generalized data quality assessment and preprocessing toolkit for CER or other observational data using EHRs. Instead of categorizing data quality issues into different specific dimensions, our framework emphasizes the suitability (accuracy) and the availability (completeness) of the data for a specific research purpose. The framework builds step-by-step procedures from deciding what data to extract to solving verified quality problems. These procedures encourage researchers to understand their data, verify quality problems based on potential mechanisms and use other information as much as possible to solve quality problems. The framework was applied to our case study and proved useful to a research setting with laboratory test data, diagnosis data and prescription data. Considering the commonality of EHRs, we believe the framework could serve for other research settings to assess and report on data quality. We would like to stress that applying the framework and report on data quality assessment is relevant in general, and not only in case of (expected) major significant impact on outcome. The relevance is in the transparency and trust the data are valid to answer the research questions at hand.
However, there are still questions that need to be answered. It should be noticed that the rapid advances in medical technology have given rise to a variety of high-dimensional data [34]. Data quality assessment using our framework for all required information in a high-dimensional dataset would result in thousands of data quality measures and be time consuming. Thus, it is important to adapt the framework for high-dimensional dataset. The rule for desired sensitivity of signals in our framework should be adapted for high-dimensional data. Decisions need to be made to optimize the resource distribution for data quality assurance in a setting of limited resources, for example, quality assessment and processing may be applied for those covariates with important expected impact on outcomes instead of all covariates. A further effort is needed to develop the appropriate data quality assessment methods for high-dimensional data.
In addition, our framework focuses on how to assess and process data quality problems. Although the procedures in the framework creates a set of descriptive methods and other quality identification and processing methods, how it still needs to be further integrated in guidelines for reporting the results from data quality analyses [27]. Reporting data quality assurance for EHR data in published studies should be brought to the attention to improve practices and trust in the clinical evidence.
| Steps | Key procedures in the steps |
|---|---|
| Assumptions | Assume data are accurate and complete enough to provide accurate findings |
| Requirements | 1. Define what information is needed to answer the research question with the chosen design 2. Define what granularity (level of detail) of information is required |
| Assumption falsification | 1. Establish prior knowledge of the data: – Known mechanisms that could cause data quality problems – How these problems are presented in the datasets 2. Generate signals: – Signals are observations with possible quality problems – Desired sensitivity of signals should be decided based on the expected impact of residual quality problems on the outcomes of the analyses 3. Verify signals: – Consider likely causal mechanisms to identify problems – Prove that assumptions are not true |
| Problems correction | Select the optimal solution for true problems: – Use other information from database – Make decision based on the necessity of information for the analysis |
| Designed data analyses | Required information | Required data granularities |
|---|---|---|
| Survival analysis to compare ACEis with ARBs on renal function decline in patients with DM2 | – Outcome measurements (renal function) | – Outcome: eGFR and albuminuria values from a set of laboratory tests with their dates |
| – Drug exposure (ACEis/ARBs and co-medications) | – Drug exposure: daily dosage, duration and start date of all ACEi/ARB and co-medication prescriptions | |
| – Other covariates (biomarkers, comorbidities) measurements during follow-up | – Covariates: biomarker values and dates, new comorbidities diagnoses and dates | |
| Propensity score matching to minimize confounding by indication | Baseline values of renal function, demographic and biomarker values, comorbidities and co-medication history | – Last observation of renal function, biomarkers measurements in the year before ACEi/ARB initiation; |
| – Comorbidities and co-medication history |
ACEI: Agiotensin-converting enzyme inhibitor; ARB: Angiotensin receptor blocker;
| Assumption | Requirements | Assumption falsification | Decisions for true problems | ||
|---|---|---|---|---|---|
| Prior knowledge of mechanisms causing problems | Generating signals | Evaluate signals | |||
| Data are accurate | True value and true dates of measurements of renal function, biomarkers, comorbidity diagnoses and all prescription information (dosage/duration/start date) | Accuracy problems of values and dates: – Typing error – Date misclassification due to historical records – Inconsistent use of measurement units Accuracy problem of actual drug use: – Early refilling, stockpiling, dosage switching, duplicate artifact prescriptions | Potential unreasonable values: e.g., HbA1c >20 Rapid value change in time: e.g., HbA1c change more than 30% comparing to average value in last 90 days Impossible dates beyond research period Duplicate prescriptions with same dosage, duration and date Duration of one prescription did not equal to the gap between two prescription issuing dates | Use source data (e.g., contextual information) and other information in the dataset (e.g., neighboring observations) for verification of signals of possible inaccurate problems Need extra solutions to approximate actual prescription start date | Correct values if reliable or deduced values can be obtained from other information Make the observation missing and impute at analysis level Remove observations Remove patients Correct stockpiled prescriptions Correct for dosage change |
| Data are complete | Complete information of measurements of renal function, biomarkers, comorbidity diagnoses, and prescriptions for follow-up and baseline | Missing information of an existing prescription: – Missing data input – Typing error Missing baseline value: – Absence of measurement of particular biomarker for a certain period ‘Concomitant missingness’ – patients temporary moving out from GP practice | Missing date, duration or dosage for an existing prescription Missing baseline value of renal function and biomarkers Sets of observations missing simultaneously in a period | Verified as true problems Verified as true problems Data visualization techniques of source data | Impute dosage/duration using other information Remove the prescription Exclude patients if baseline eGFR was missing Use imputation techniques for albuminuria and biomarkers at analysis level Remove patients |
eGFR: Estimated glomerular filtration rate; GP: General practitioner.
Define the required information
If the study needs a fixed outcome to answer the question, for example, the first BP measure in a period, a single observation is sufficient. If the study uses a time-to-event design, for example, the occurrence of a BP measure above 150 mmHg, all available BP observations and their dates are required
Define the required granularity
Taking BP as example again, the outcome could be defined as having hypertension or not (yes/no for BP above 140/90 mmHg), the exact BP value, an averaged BP in a period or even a trajectory of BP observations
BP: Blood pressure.
We have BP after 4 months as the outcome to compare two drugs, and we adjust for BMI and BP at baseline. Since BP is used twice and is used as the outcome measure, we expect inaccuracies in BP to have more impact than those in BMI. Therefore, it would be a good idea to use more sensitive signals to detect BP inaccuracies than to detect BMI accuracy problems.
BP: Blood pressure.
For dealing with an inaccurate or incomplete prescription dosage:
Correct dosage value using textual information in the drug's label text
If drug's label text is not available, dosage could also be deduced from neighboring prescriptions of the same drug in case of a stable trajectory of prescribed dosages
In case such imputation cannot be done reliably, the consequence will be either exclusion of the prescription or dropping the patient from the dataset, each having their cost:
Maybe imputing a less reliable dosage is considered to be less harmful than removing the prescription, which would underestimate the patient's exposure to the medication
On the other hand, the researcher may prefer not to accept a possible exposure misclassification (e.g., in case it is the study drug) and excludes the patient
Reported quality assessment of electronic health record data is urgently needed for comparative effectiveness research studies. Detailed description of data quality assessment and actions to ensure high-quality datasets for research will contribute to the development of a system to share best practices.
The proposed framework is based on the concept of ‘fit-for-use’ which accommodate the task-dependent nature of data quality and allows researchers to determine the suitability of datasets for specific research tasks.
The framework consists of four steps: define the general assumptions, define requirements for the data based on the research task, generate listings of observations with possible quality problems and verify whether the general assumptions are not true for those observations and select the best strategies to handle the data with verified quality problems.
The general framework was shown to be applicable and useful in a specific case study.
Financial & competing interests disclosure
The authors have no relevant affiliations or financial involvement with any organization or entity with a financial interest in or financial conflict with the subject matter or materials discussed in the manuscript. This includes employment, consultancies, honoraria, stock ownership or options, expert testimony, grants or patents received or pending, or royalties.
No writing assistance was utilized in the production of this manuscript.
References
Papers of special note have been highlighted as: • of interest; •• of considerable interest
1.
Sox HC, Goodman SN. The methods of comparative effectiveness research. Ann. Rev. Public Health 33, 425–445 (2012).
2.
Tanenbaum SJ. Comparative effectiveness research: evidence-based medicine meets health care reform in the USA. J. Eval. Clin. Pract. 15, 976–984 (2009).
3.
Alemayehu D, Cappelleri JC. Revisiting issues, drawbacks and opportunities with observational studies in comparative effectiveness research. J. Eval. Clin. Pract. 19(4), 579–583 (2013).
4.
Fleurence RL, Naci H, Jansen JP. The critical role of observational evidence in comparative effectiveness research. Health Aff. (Millwood) 29(10), 1826–1833 (2010).
5.
Caruso D, Kerrigan C, Mastanudo M. Improving the value-based care and outcomes of clinical populations in an electronic health record system environment. The Dartmouth Institute for Health Policy & Clinical Practice [serial online] (2011). http://tdi.dartmouth.edu.
6.
D'Avolio LW, Farwell WR, Fiore LD. Comparative effectiveness research and medical informatics. Am. J. Med. 123(12 Suppl. 1), e32–e37 (2010).
7.
Weiner MG, Embi PJ. Toward reuse of clinical data for research and quality improvement: the end of the beginning? Ann. Intern. Med. 15, 359–360 (2009).
8.
Gallego B, Dunn AG, Coiera E. Role of electronic health records in comparative effectiveness research. J. Comp. Eff. Res. 2(6), 529–532 (2013).
9.
Etheredge LM. Creating a high-performance system for comparative effectiveness research. Health Aff. (Millwood) 29(10), 1761–1767 (2010).
10.
Bayley KB, Belnap T, Savitz L et al. Challenges in using electronic health record data for CER: experience of 4 learning organizations and solutions applied. Med. Care 51(8 Suppl. 3), S80–S86 (2013).
11.
Hersh WR, Weiner MG, Embi PJ et al. Caveats for the use of operational electronic health record data in comparative effectiveness research. Med. Care 51(8 Suppl. 3), S30–S37 (2013).
12.
Wang RY, Strong DM. Beyond accuracy: what data quality means to data consumers. J. Manag. Info. Syst. 12(4), 5–34 (1996).
•• The article that developed the concept of ‘fit-for-use’.
13.
Wand Y, Wang R. Anchoring data quality dimensions in ontological foundations. Comm. ACM 39, 86–95 (1996).
14.
Arts DG, De Keizer NF, Scheffer GJ. Defining and improving data quality in medical registries: a literature review, case study, and generic framework. J. Am. Med. Inform. Assoc. 9(6), 600–611 (2002).
15.
Dixon BE, Rosenman M, Xia Y et al. A vision for the systematic monitoring and improvement of the quality of electronic health data. Stud. Health Technol. Inform. 192, 884–888 (2013).
16.
Botsis T, Hartvigsen G, Chen F et al. Secondary use of EHR: data quality issues and informatics opportunities. AMIA Jt Summits Transl. Sci. Proc. 2010, 1–5 (2010).
17.
Weiskopf NG, Hripcsak G, Swaminathan S et al. Defining and measuring completeness of electronic health records for secondary use. J. Biomed. Inform. 46(5), 830–836 (2013).
18.
Berner ES, Kasiraman RK, Yu F et al. Data quality in the outpatient setting: impact on clinical decision support systems. AMIA Annu. Symp. Proc. 2005, 41–45 (2005).
19.
Hripcsak G, Albers DJ. Next-generation phenotyping of electronic health records. J. Am. Med. Inform. Assoc. 20, 117–121 (2012).
20.
Overhage JM, Overhage LM. Sensible use of observational clinical data. Stat. Methods Med. Res. 22, 7–13 (2011).
21.
Safran C, Bloomrosen M, Hammond WE et al. Toward a national framework for the secondary use of health data: an American Medical Informatics Association White Paper. J. Am. Med. Inform. Assoc. 14(1), 1–9 (2007).
22.
Hersh WR, Cimino J, Payne PR et al. Recommendations for the use of operational electronic health record data in comparative effectiveness research. EGEMS (Wash DC) 1(1), 14 (2013).
23.
Agency for Healthcare Research and Quality. Developing a Protocol for Observational Comparative Effectiveness Research – A User's Guide. Velentgas P, Dreyer NA, Nourjah P (Eds). Government Printing Office, Washington, DC, USA (2013).
24.
Holve E, Kahn M, Nahm M et al. A comprehensive framework for data quality assessment in CER. AMIA Jt Summits Transl. Sci. Proc. 2013, 86–88 (2013).
25.
The GRACE Initiative. Grace principles: good research for comparative effectiveness (2010). www.graceprinciples.org/doc/GRACE_Principles_10April2010.pdf.
26.
Chan KS, Fowles JB, Weiner JP. Review: electronic health records and the reliability and validity of quality measures: a review of the literature. Med. Care Res. Rev. 67(5), 503–527 (2010).
27.
Kahn MG, Brown JS, Chun AT et al. Transparent reporting of data quality in distributed data networks. EGEMS (Wash DC) 3(1), 1052 (2015).
28.
Los RK, Roukema J, van Ginneken AM et al. Are structured data structured identically? Investigating the uniformity of pediatric patient data recorded using OpenSDE. Methods Inf. Med. 44(5), 631–638 (2005).
29.
Huang Y, Haaijer-Ruskamp FM, Voorham J. Comparing the effect of ACE inhibitors and angiotensin receptor blockers on renal function decline in diabetes. J. Comp. Eff. Res. 5(3), 229–237 (2016).
•• The original research of the case study.
30.
Voorham J, Denig P. Computerized extraction of information on the quality of diabetes care from free text in electronic patient records of general practitioners. J. Am. Med. Inform. Assoc. 14(3), 349–354 (2007).
31.
Voorham J, Haaijer-Ruskamp FM, Wolffenbuttel BH et al. Medication adherence affects treatment modifications in patients with Type 2 diabetes. Clin. Ther. 33(1), 121–134 (2011).
• The article that described the preprocessing of the prescription data.
32.
Kahn MG, Raebel MA, Glanz JM et al. A pragmatic framework for single-site and multisite data quality assessment in electronic health record-based clinical research. Med. Care 50(Suppl.), S21–S29 (2012).
33.
Brown JS, Kahn M, Toh S. Data quality assessment for comparative effectiveness research in distributed data networks. Med. Care 51(8 Suppl. 3), S22–S29 (2013).
34.
Wu Z, Wu Z. Exploration, visualization, and preprocessing of high-dimensional data. Methods Mol. Biol. 620, 267–284 (2010).
Information & Authors
Information
Published In
Copyright
© Future Medicine Ltd.
History
Published online: 27 June 2016
Keywords:
Topics
Authors
Metrics & Citations
Metrics
Article Usage
Article usage data only available from February 2023. Historical article usage data, showing the number of article downloads, is available upon request.
Citations
How to Cite
Using primary care electronic health record data for comparative effectiveness research: experience of data quality assessment and preprocessing in The Netherlands. (2016) Journal of Comparative Effectiveness Research. DOI: 10.2217/cer-2015-0022
Export citation
Select the citation format you wish to export for this article or chapter.
Citing Literature
- Elham Hosseinzadeh, Marziyeh Afkanpour, Mehri Momeni, Hamed Tabesh, Data quality assessment in healthcare, dimensions, methods and tools: a systematic review, BMC Medical Informatics and Decision Making, 10.1186/s12911-025-03136-y, 25, 1, (2025).
- Sharmala Thuraisingam, D Himasara Marasinghe, Kendra Barrick, Fariba Aghajafari, Jo-Anne Manski-Nankervis, Michelle M Dowsey, Hude Quan, Tyler Williamson, Stephanie Garies, Comparing the Quality of Primary Care Electronic Health Record Data in Australia and Canada: Case Study in Osteoarthritis, Journal of Medical Internet Research, 10.2196/69631, 27, (e69631), (2025).
- Doyeon An, Minsik Lim, Suehyun Lee, Challenges of Data Quality in Clinical Data Life Cycle: A Systematic Review (Preprint), Journal of Medical Internet Research, 10.2196/60709, (2024).
- Sharmala Thuraisingam, Patty Chondros, Michelle M. Dowsey, Tim Spelman, Stephanie Garies, Peter F. Choong, Jane Gunn, Jo-Anne Manski-Nankervis, Assessing the suitability of general practice electronic health records for clinical prediction model development: a data quality assessment, BMC Medical Informatics and Decision Making, 10.1186/s12911-021-01669-6, 21, 1, (2021).